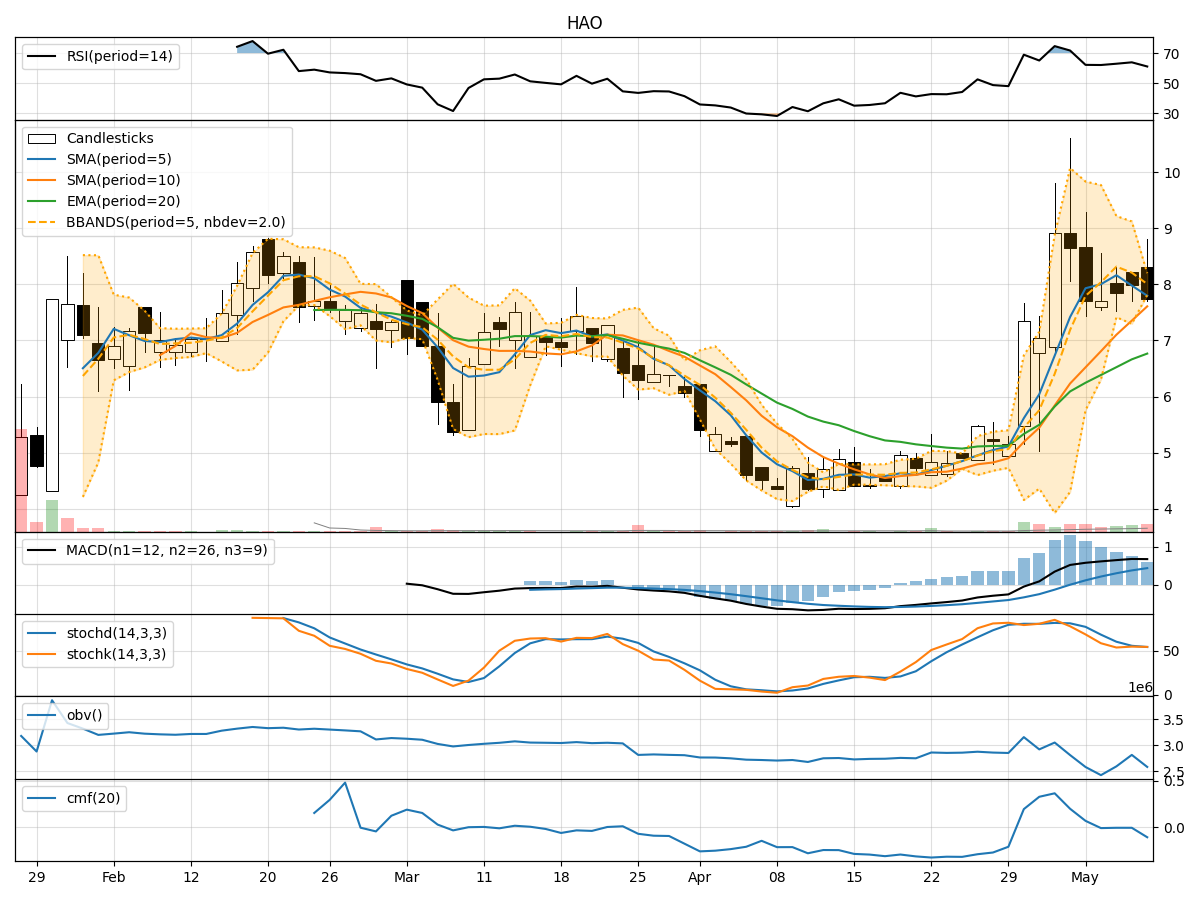
Technical Analysis of HAO 2024-05-10
Overview:
In analyzing the technical indicators for HAO stock over the last 5 days, we will delve into the trend, momentum, volatility, and volume indicators to provide a comprehensive outlook on the possible stock price movement in the coming days.
Trend Analysis:
- Moving Averages (MA): The 5-day Moving Average (MA) has been declining, indicating a short-term bearish trend.
- MACD: The MACD line has been consistently above the signal line, suggesting a bullish momentum.
- EMA: The Exponential Moving Average (EMA) has been steadily increasing, reflecting a positive trend.
Momentum Analysis:
- RSI: The Relative Strength Index (RSI) has been fluctuating around the 60-65 range, indicating a neutral momentum.
- Stochastic Oscillator: Both %K and %D have been hovering around 50, suggesting a lack of clear direction.
- Williams %R: The Williams %R is in the oversold territory, indicating a potential reversal.
Volatility Analysis:
- Bollinger Bands: The Bollinger Bands have been narrowing, indicating decreasing volatility.
- Bollinger %B: The %B indicator has been fluctuating within a narrow range, suggesting stability in price movements.
Volume Analysis:
- On-Balance Volume (OBV): The OBV has been declining, indicating selling pressure.
- Chaikin Money Flow (CMF): The CMF has been negative, suggesting outflow of money from the stock.
Key Observations:
- The trend indicators show a mixed signal with the MA indicating a bearish trend while the MACD and EMA suggest a bullish sentiment.
- Momentum indicators are neutral with RSI fluctuating, Stochastic Oscillator showing indecision, and Williams %R signaling oversold conditions.
- Volatility has been decreasing, indicating a potential period of consolidation.
- Volume indicators reflect selling pressure with OBV declining and CMF showing negative money flow.
Conclusion:
Based on the analysis of the technical indicators, the stock price of HAO is likely to experience sideways movement in the coming days. The conflicting signals from trend and momentum indicators, coupled with decreasing volatility and negative volume indicators, suggest a period of consolidation. Traders should exercise caution and wait for clearer signals before making significant trading decisions.