Technical Analysis of GURE 2024-05-10
Overview:
In analyzing the technical indicators for GURE over the last 5 days, we will delve into the trend, momentum, volatility, and volume indicators to provide a comprehensive outlook on the possible stock price movement in the coming days. By examining these key indicators, we aim to offer valuable insights and predictions for informed decision-making.
Trend Analysis:
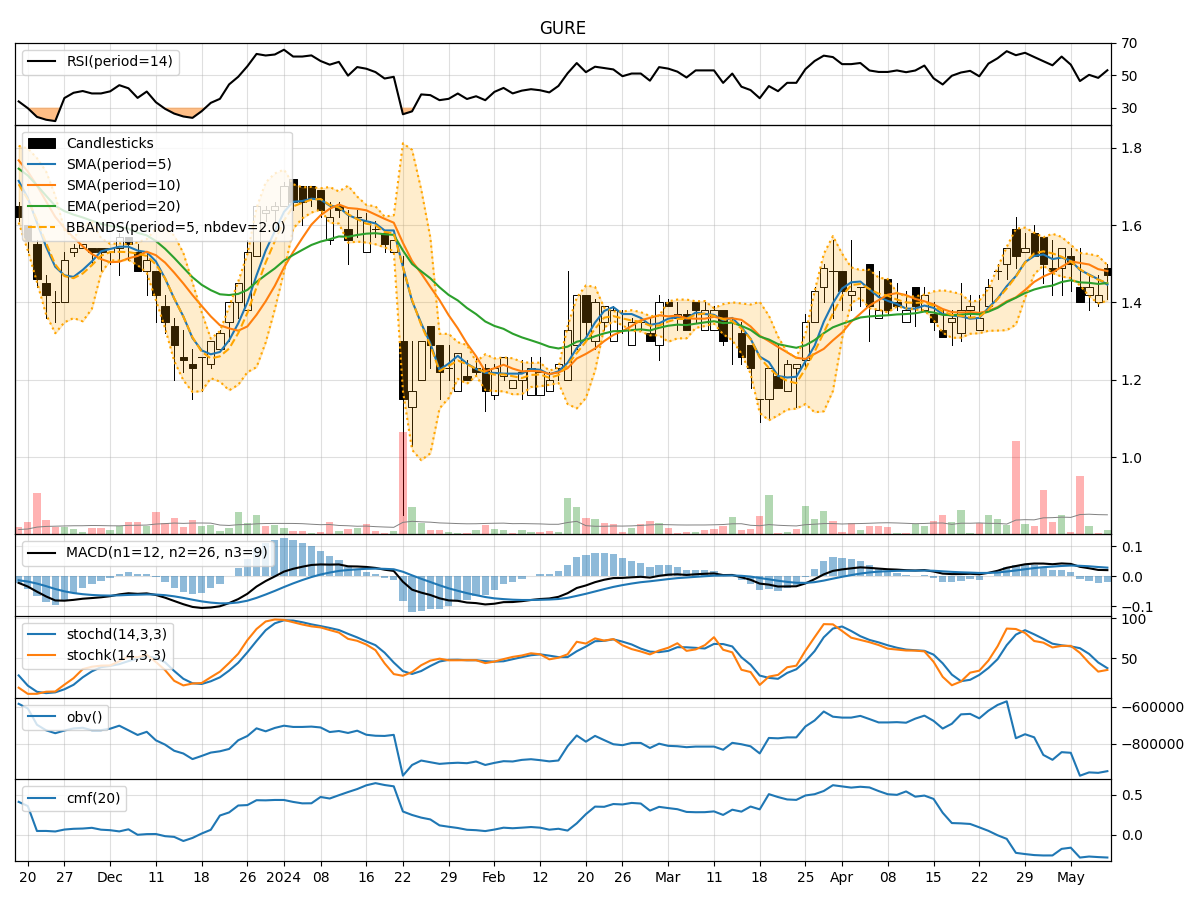
- Moving Averages (MA): The 5-day MA has been fluctuating around the closing prices, indicating short-term price trends. The SMA(10) and EMA(20) have shown a slight downward trend, suggesting a potential bearish sentiment.
- MACD: The MACD line has been positive, but the MACD Histogram has been decreasing, signaling a possible weakening of the bullish momentum.
Momentum Analysis:
- RSI: The RSI has been oscillating around the 50 level, indicating a neutral momentum with no clear overbought or oversold conditions.
- Stochastic Oscillator: Both %K and %D have been in the lower range, suggesting a bearish momentum.
- Williams %R: The indicator has been in the oversold territory, indicating a potential reversal or bounce.
Volatility Analysis:
- Bollinger Bands (BB): The bands have been narrowing, indicating decreasing volatility and a potential consolidation phase.
- Bollinger %B: The %B indicator has been fluctuating around the midline, reflecting a lack of clear direction in price movement.
Volume Analysis:
- On-Balance Volume (OBV): The OBV has been fluctuating, indicating indecision among market participants.
- Chaikin Money Flow (CMF): The CMF has been negative, suggesting selling pressure in the market.
Key Observations:
- The trend indicators show a potential bearish sentiment with a weakening bullish momentum.
- Momentum indicators suggest a neutral to bearish outlook with oversold conditions.
- Volatility indicators point towards decreasing volatility and a possible consolidation phase.
- Volume indicators reflect indecision among market participants with selling pressure.
Conclusion:
Based on the analysis of the technical indicators, the stock price of GURE is likely to experience further downward movement in the coming days. The overall sentiment is bearish, supported by weakening trends, bearish momentum, decreasing volatility, and selling pressure indicated by volume indicators. Traders and investors should exercise caution and consider short-term selling strategies or wait for a clearer signal before entering any long positions.