Technical Analysis of GRNQ 2024-05-10
Overview:
In analyzing the technical indicators for GRNQ over the last 5 days, we will delve into the trend, momentum, volatility, and volume indicators to provide a comprehensive outlook on the possible stock price movement in the coming days. By examining these key aspects, we aim to offer valuable insights and predictions to guide your investment decisions.
Trend Analysis:
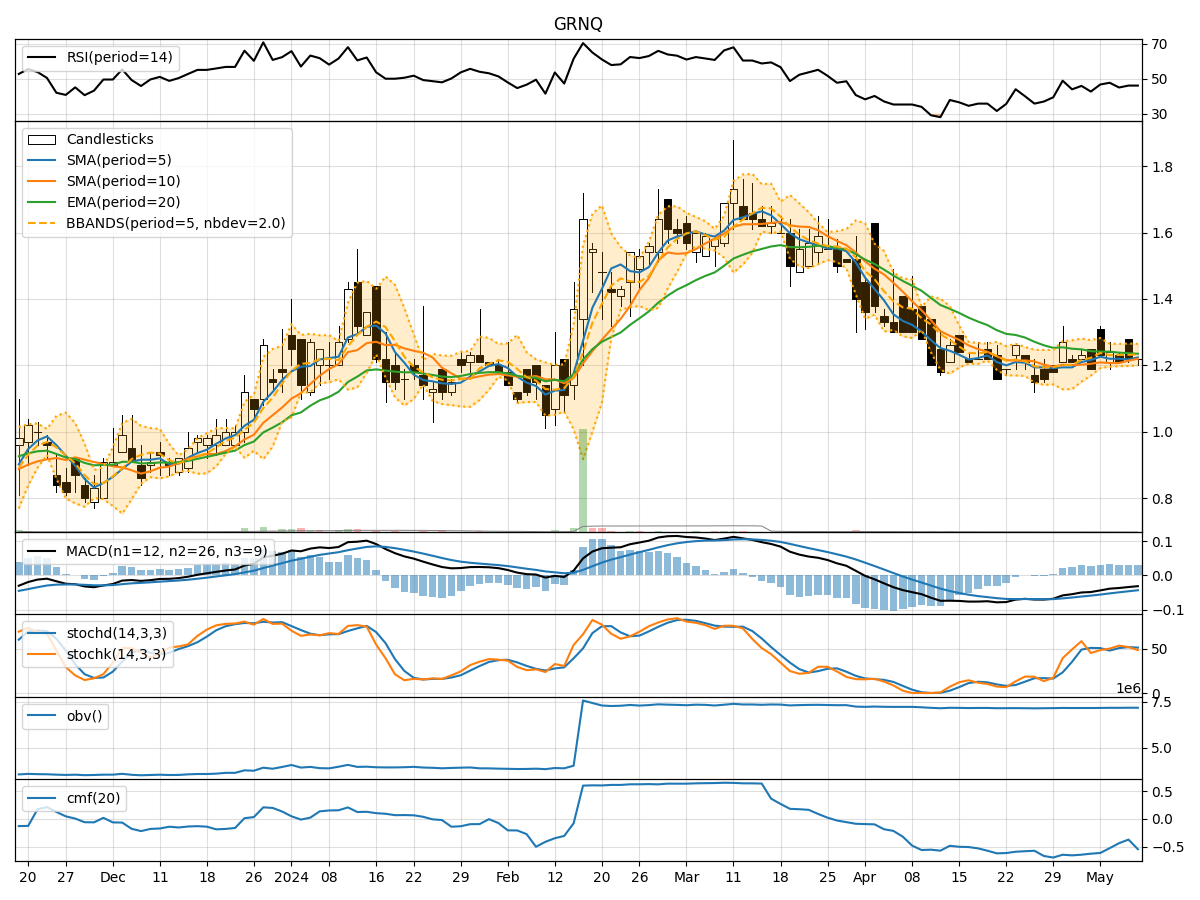
- Moving Averages (MA): The 5-day MA has been fluctuating around the current price, indicating a lack of clear trend direction.
- MACD: The MACD has been consistently negative, suggesting a bearish momentum in the short term.
- EMA: The EMA has been gradually declining, reflecting a downward trend in the stock price.
Key Observation: The trend indicators point towards a bearish sentiment in the short term.
Momentum Analysis:
- RSI: The RSI values have been hovering around the mid-range, indicating a neutral momentum.
- Stochastic Oscillator: Both %K and %D values have shown mixed signals, with no clear indication of overbought or oversold conditions.
- Williams %R: The Williams %R values have been fluctuating around the midpoint, suggesting a balanced momentum.
Key Observation: The momentum indicators suggest a neutral stance with no strong directional bias.
Volatility Analysis:
- Bollinger Bands (BB): The bands have been narrowing, indicating decreasing volatility in the stock price.
- Bollinger %B: The %B values have been fluctuating within a tight range, reflecting stable volatility levels.
Key Observation: Volatility indicators signal a consolidation phase with limited price fluctuations.
Volume Analysis:
- On-Balance Volume (OBV): The OBV values have remained relatively stable, indicating a balance between buying and selling pressure.
- Chaikin Money Flow (CMF): The CMF values have been negative, suggesting a net outflow of money from the stock.
Key Observation: Volume indicators imply a neutral to slightly bearish sentiment in terms of market participation.
Conclusion:
Based on the analysis of trend, momentum, volatility, and volume indicators, the overall outlook for GRNQ in the next few days appears to be bearish with a consolidation pattern. The stock is likely to experience continued downward pressure in the short term, supported by the negative trend and momentum signals. However, the stable volatility and volume levels may lead to a sideways movement before any significant price action.
Recommendation: Considering the current technical signals, it is advisable to exercise caution and closely monitor the stock for any potential breakout or reversal patterns. Traders may consider short-term selling opportunities or wait for clearer signals before initiating new positions.
Key Words: Bearish, Consolidation, Neutral Momentum, Stable Volatility, Caution.