Technical Analysis of GRIN 2024-05-10
Overview:
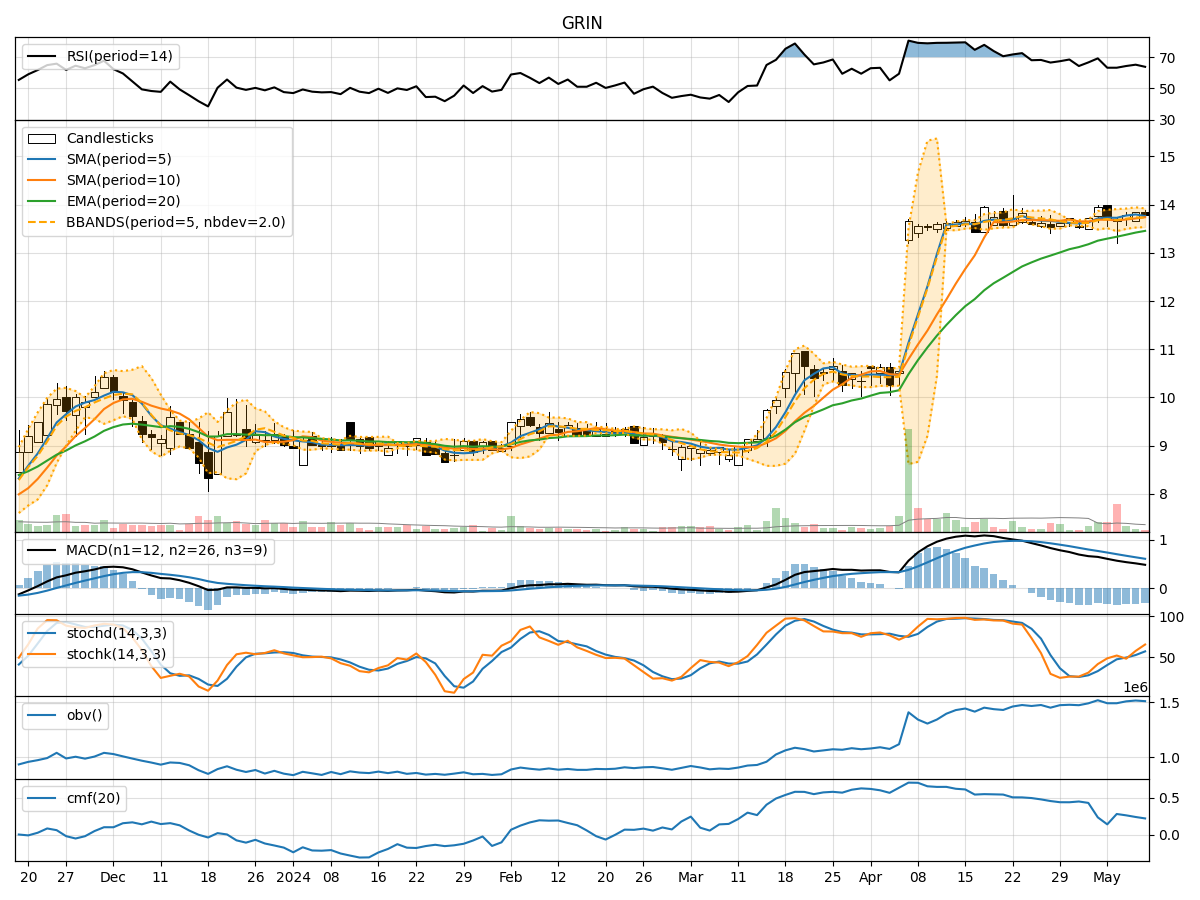
In analyzing the technical indicators for GRIN over the last 5 days, we will delve into the trend, momentum, volatility, and volume indicators to provide a comprehensive outlook on the possible stock price movement in the coming days.
Trend Analysis:
- Moving Averages (MA): The 5-day MA has been fluctuating around the closing prices, indicating a short-term trend. The SMA(10) and EMA(20) have been gradually increasing, suggesting a bullish trend.
- MACD: The MACD line has been consistently above the signal line, with both lines in positive territory. The MACD histogram has shown a slight decrease but remains positive, indicating a potential slowdown in bullish momentum.
Momentum Analysis:
- RSI: The RSI has been hovering in the neutral zone around 60-65, indicating a balanced momentum without extreme overbought or oversold conditions.
- Stochastic Oscillator: Both %K and %D lines of the Stochastic Oscillator have been trending upwards, reflecting increasing buying pressure and positive momentum.
- Williams %R: The Williams %R has been moving towards the oversold territory, suggesting a potential buying opportunity.
Volatility Analysis:
- Bollinger Bands: The stock price has been trading within the Bollinger Bands, with the bands narrowing slightly. This indicates decreasing volatility and a possible period of consolidation.
- Bollinger %B: The %B indicator has been fluctuating around 0.5, indicating the stock is trading at the middle of the bands.
Volume Analysis:
- On-Balance Volume (OBV): The OBV has shown a slight increase over the last few days, indicating a positive accumulation of volume.
- Chaikin Money Flow (CMF): The CMF has been positive, suggesting that money is flowing into the stock over the 20-day period.
Conclusion:
Based on the analysis of the technical indicators, the stock of GRIN is likely to experience sideways movement in the coming days. The trend indicators suggest a bullish bias with the moving averages trending upwards. However, the momentum indicators show a neutral to slightly bullish sentiment, with no extreme overbought conditions. The volatility indicators point towards a consolidation phase with decreasing volatility. The volume indicators indicate positive accumulation of volume, supporting the potential for a stable price movement.
In conclusion, while there may be short-term fluctuations, the overall outlook for GRIN suggests a sideways consolidation pattern with a slight bullish bias. Investors should monitor key support and resistance levels for potential entry or exit points, considering the balanced momentum and stable volume accumulation.