Technical Analysis of GRAB 2024-05-10
Overview:
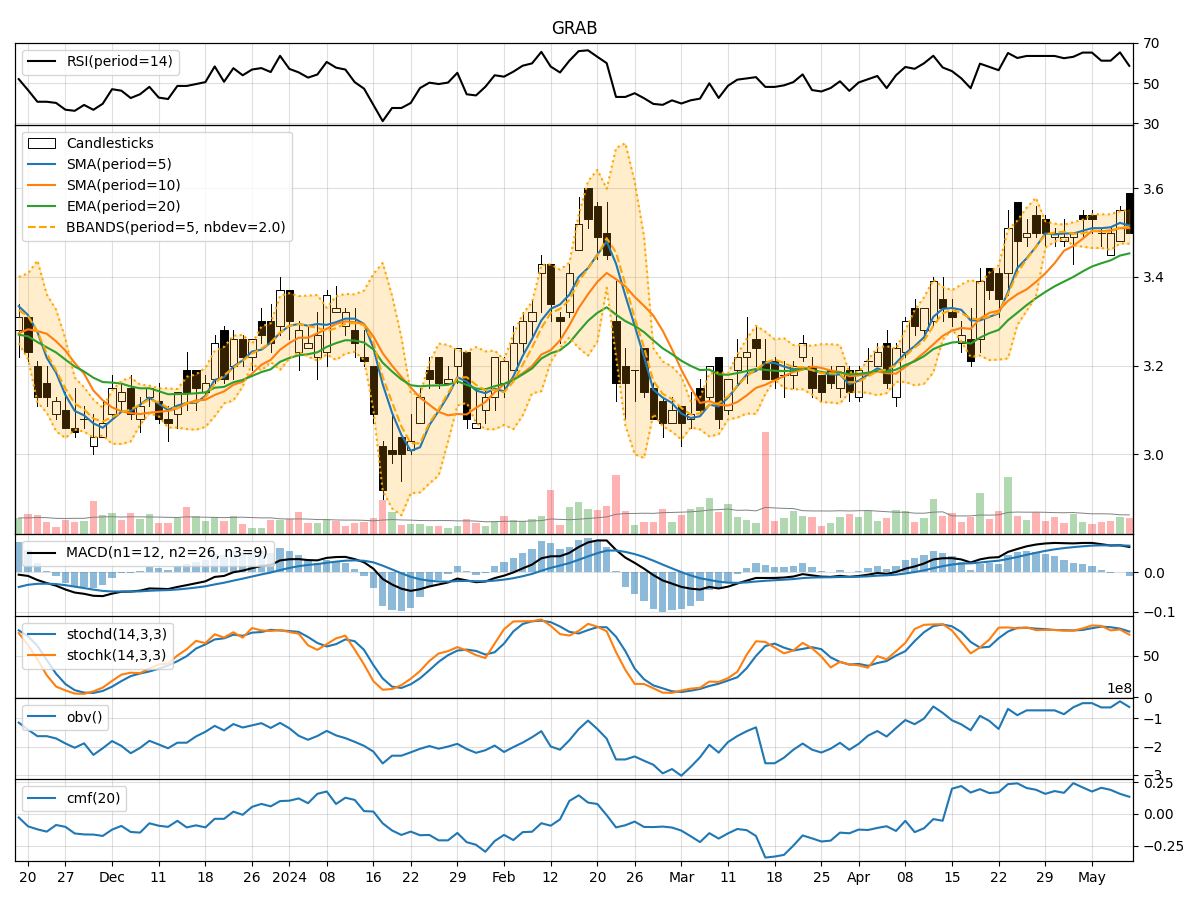
In analyzing the technical indicators for GRAB stock over the last 5 days, we will delve into the trend, momentum, volatility, and volume indicators to provide a comprehensive outlook on the possible stock price movement in the coming days. By examining these key indicators, we aim to offer valuable insights and predictions for informed decision-making.
Trend Analysis:
- Moving Averages (MA): The 5-day Moving Average (MA) has been relatively stable around 3.51, indicating a consistent trend in the stock price.
- MACD and Signal Line: The MACD line has shown a slight decrease over the last 5 days, with the MACD histogram also trending downwards, suggesting a potential weakening of the bullish momentum.
Momentum Analysis:
- RSI: The Relative Strength Index (RSI) has fluctuated within the neutral range, indicating a balanced momentum between buying and selling pressure.
- Stochastic Oscillator: Both %K and %D values have been declining, signaling a potential bearish momentum in the stock.
Volatility Analysis:
- Bollinger Bands (BB): The Bollinger Bands have shown a narrowing of the bands, indicating decreasing volatility in the stock price.
- Bollinger %B: The %B value has been fluctuating around 0.3-0.8, suggesting moderate volatility in the stock.
Volume Analysis:
- On-Balance Volume (OBV): The OBV has shown mixed movements over the last 5 days, indicating indecision among investors regarding the stock.
- Chaikin Money Flow (CMF): The CMF has been relatively stable around 0.15-0.20, suggesting a neutral sentiment towards the stock.
Key Observations:
- The trend indicators show a stable moving average but a potential weakening of bullish momentum according to the MACD.
- Momentum indicators suggest a balanced momentum with a slight bearish bias based on the Stochastic Oscillator.
- Volatility indicators point towards decreasing volatility in the stock price.
- Volume indicators reflect mixed movements and a neutral sentiment among investors.
Conclusion:
Based on the analysis of the technical indicators, the stock of GRAB is likely to experience sideways movement in the coming days. The stable moving average, neutral RSI, and mixed volume movements indicate a lack of clear direction in the stock price. However, the potential weakening of bullish momentum according to the MACD and bearish bias in the Stochastic Oscillator suggest a slight downside risk. Investors should closely monitor further price action and key support levels for potential entry or exit points.
Recommendation:
Given the current technical outlook, it is advisable for investors to exercise caution and wait for clearer signals before making significant trading decisions. Consider setting tight stop-loss orders to manage risk effectively in the current market environment. Additionally, staying informed about any upcoming news or events that could impact the stock price is crucial for making informed investment choices.