Technical Analysis of GP 2024-05-10
Overview:
In analyzing the technical indicators for the stock GP over the last 5 days, we will delve into the trends, momentum, volatility, and volume aspects to provide a comprehensive outlook on the possible stock price movement in the coming days. By examining key indicators such as moving averages, MACD, RSI, Bollinger Bands, and OBV, we aim to offer valuable insights and predictions for potential price trends.
Trend Analysis:
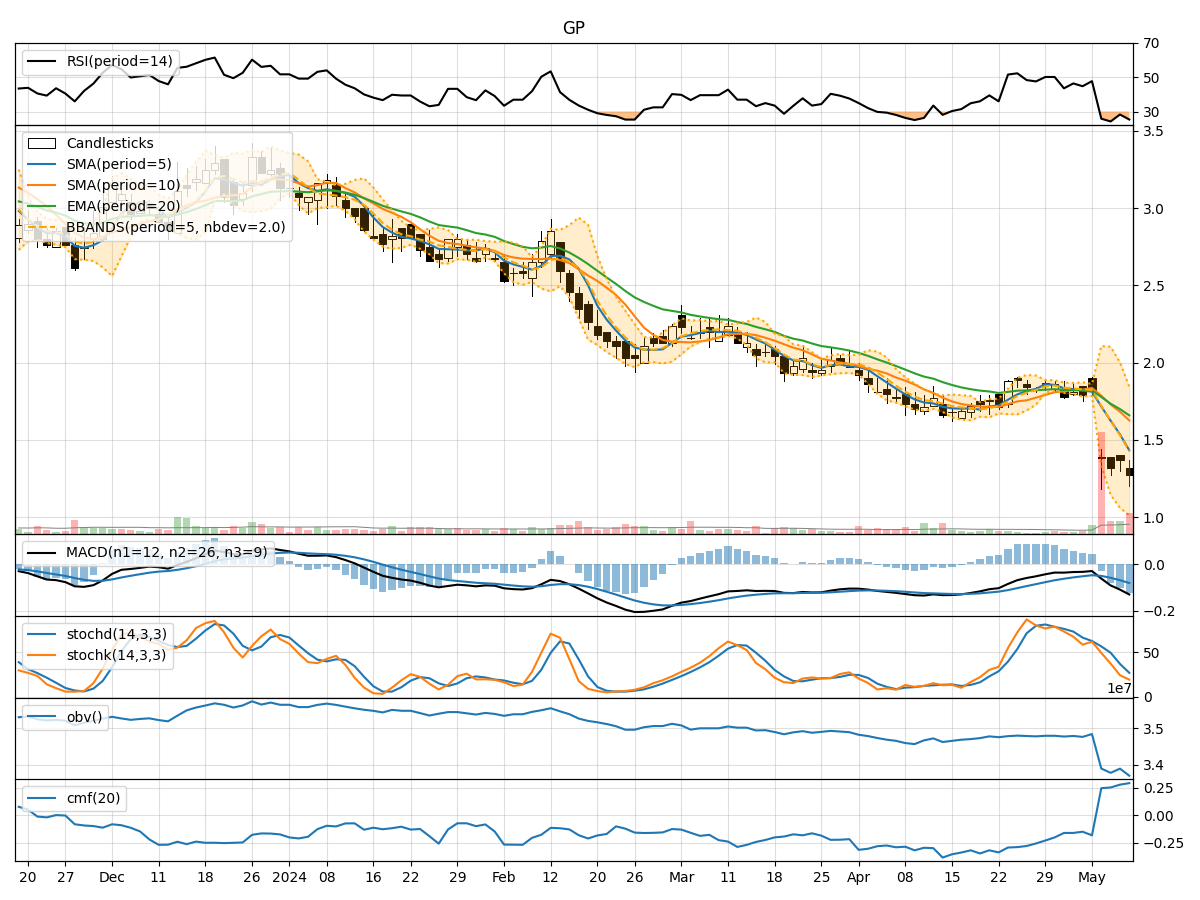
- Moving Averages (MA): The 5-day MA has been consistently declining, indicating a downward trend in the stock price.
- MACD: The MACD line has been negative and decreasing, suggesting bearish momentum in the stock.
- EMA: The EMA has also been trending downwards, aligning with the bearish sentiment in the stock.
Momentum Analysis:
- RSI: The RSI has been decreasing and is currently below 30, indicating oversold conditions and a potential reversal or bounce back in the stock price.
- Stochastic Oscillator: Both %K and %D have been declining, signaling a bearish momentum in the stock.
- Williams %R: The Williams %R is in the oversold territory, suggesting a possible reversal in the stock price.
Volatility Analysis:
- Bollinger Bands: The stock price has been consistently below the lower Bollinger Band, indicating oversold conditions and potential for a reversal or bounce back.
- Bollinger Band Width: The Band Width has been narrowing, suggesting a decrease in volatility and a possible period of consolidation.
Volume Analysis:
- On-Balance Volume (OBV): The OBV has been declining, indicating selling pressure in the stock.
- Chaikin Money Flow (CMF): The CMF has been positive, suggesting buying pressure in the stock despite the declining price.
Conclusion:
Based on the technical indicators analyzed: - Trend: The stock is in a strong downward trend based on moving averages and MACD. - Momentum: The stock shows oversold conditions according to RSI and Williams %R, indicating a potential reversal. - Volatility: The narrowing Bollinger Bands suggest a period of consolidation before a potential breakout. - Volume: Despite the declining OBV, the positive CMF indicates buying pressure in the stock.
Overall Assessment:
Considering the technical indicators and analysis, the stock GP is likely to experience a short-term consolidation phase with a potential for a bullish reversal in the coming days. Traders may consider monitoring key support and resistance levels for potential entry or exit points, while investors could wait for a clearer trend confirmation before making significant decisions. It is essential to exercise caution and consider risk management strategies in light of the current market dynamics.