Technical Analysis of GOGL 2024-05-10
Overview:
In analyzing the technical indicators for GOGL over the last 5 days, we will delve into the trend, momentum, volatility, and volume indicators to provide a comprehensive outlook on the possible stock price movement in the coming days. By examining these key aspects, we aim to offer valuable insights and predictions to guide your investment decisions.
Trend Analysis:
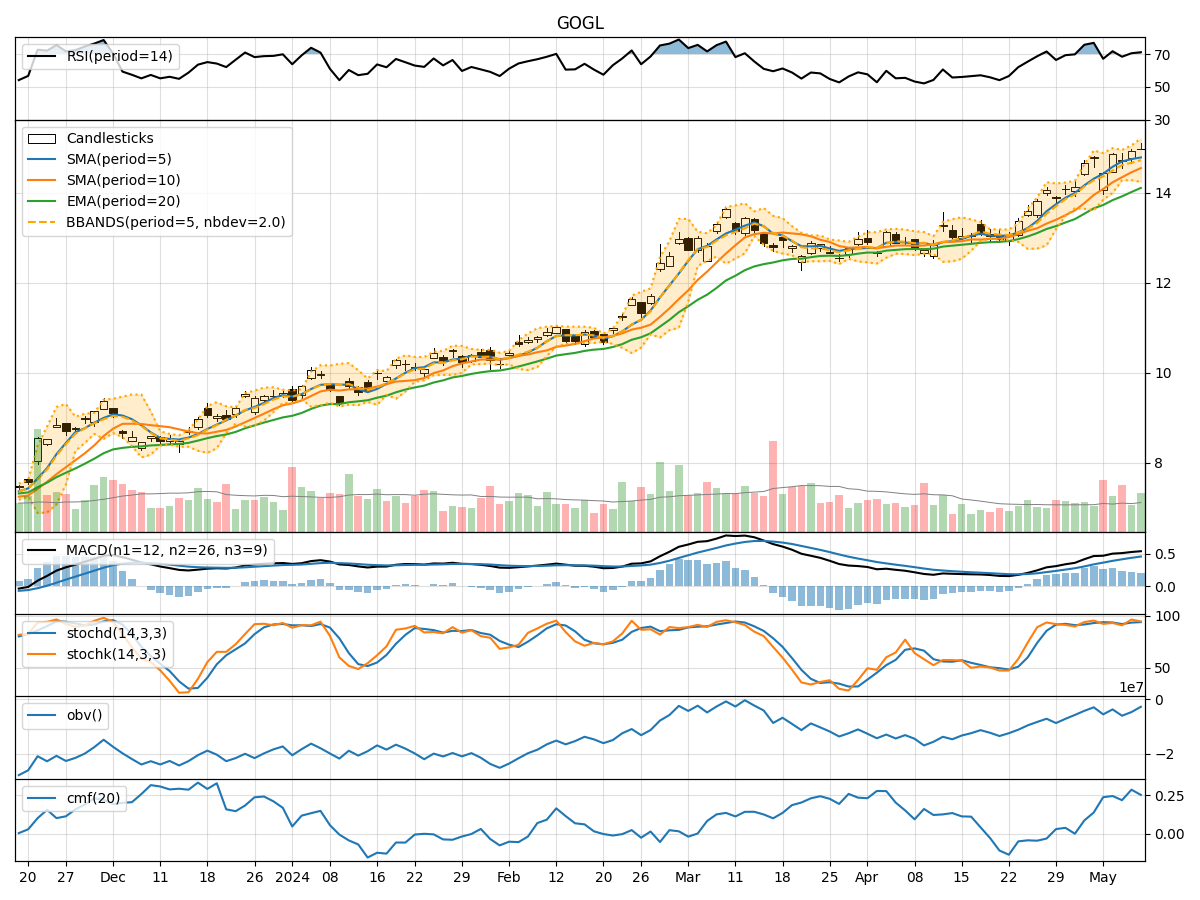
- Moving Averages (MA): The 5-day Moving Average (MA) has been consistently above the Simple Moving Average (SMA) and Exponential Moving Average (EMA), indicating an upward trend in the stock price.
- MACD: The MACD line has been above the signal line, with both lines showing an upward trajectory, suggesting bullish momentum in the stock.
Momentum Analysis:
- RSI: The Relative Strength Index (RSI) has been hovering around 70, indicating that the stock is in overbought territory.
- Stochastic Oscillator: Both %K and %D lines of the Stochastic Oscillator are in the overbought zone, signaling a potential reversal or consolidation.
Volatility Analysis:
- Bollinger Bands (BB): The stock price has been trading within the Bollinger Bands, with the bands widening slightly, indicating increased volatility in the stock.
- Bollinger %B: The %B indicator is around 0.75, suggesting that the stock is trading closer to the upper band, potentially indicating an overbought condition.
Volume Analysis:
- On-Balance Volume (OBV): The OBV has been showing positive accumulation, indicating that volume has been higher on up days compared to down days.
- Chaikin Money Flow (CMF): The CMF is positive, suggesting buying pressure in the stock.
Conclusion:
Based on the analysis of the technical indicators, the next few days' possible stock price movement for GOGL is likely to experience a short-term pullback or consolidation. The stock has shown signs of being overbought, as indicated by the RSI and Stochastic Oscillator. Additionally, the increasing volatility, as seen in the widening Bollinger Bands, may lead to a period of consolidation before potentially resuming its upward trend.
Key Points:
- Trend: Upward trend remains intact.
- Momentum: Overbought conditions suggest a potential pullback.
- Volatility: Increased volatility may lead to consolidation.
- Volume: Positive accumulation and buying pressure support the overall bullish view.
Recommendation:
Considering the overbought signals in the momentum indicators and the potential for a short-term pullback, it may be prudent to wait for a better entry point before considering a long position. Traders could look for opportunities to buy on dips or wait for a clearer signal of a continuation of the upward trend before entering a new position.