Technical Analysis of GNTA 2024-05-10
Overview:
In analyzing the technical indicators for GNTA over the last 5 days, we will delve into the trend, momentum, volatility, and volume indicators to provide a comprehensive outlook on the possible stock price movement. By examining these key aspects, we aim to offer valuable insights and predictions for the upcoming days.
Trend Analysis:
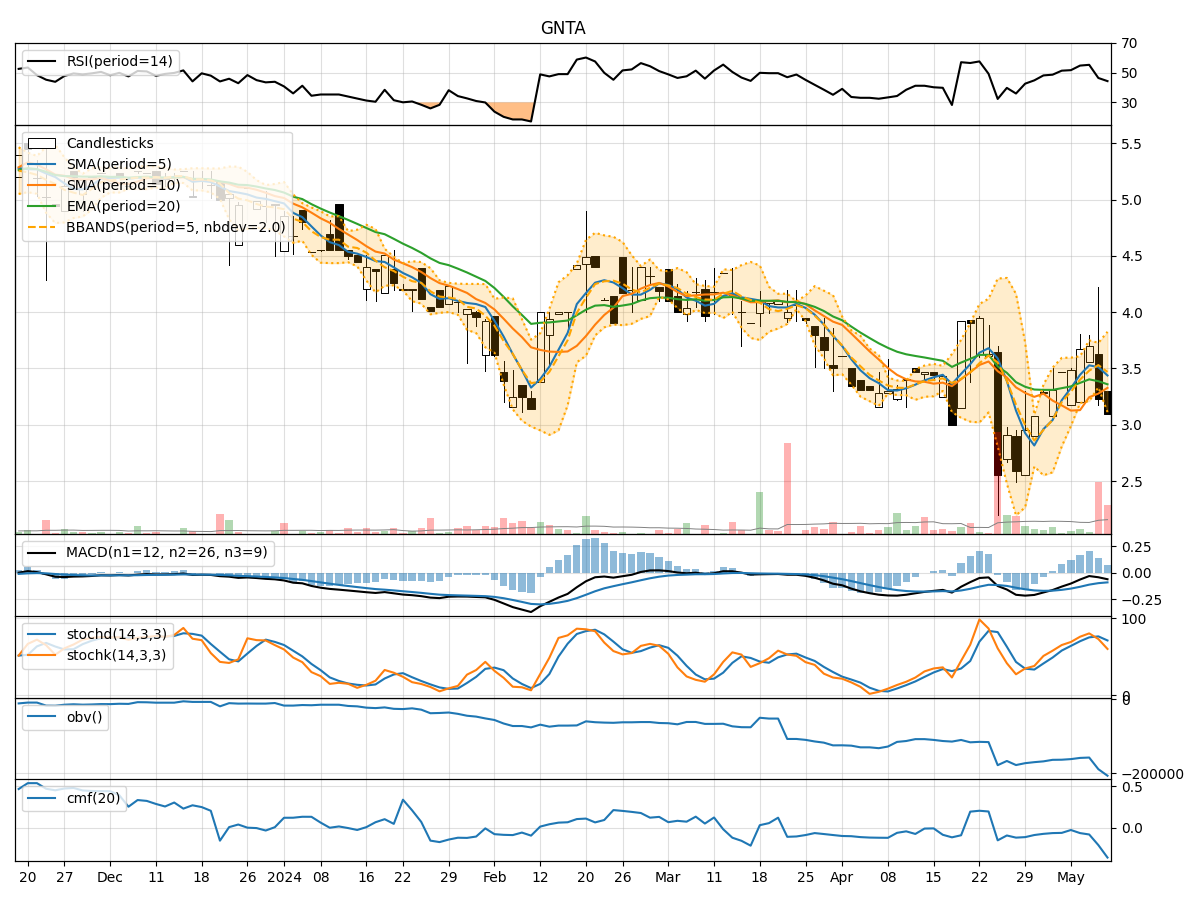
- Moving Averages (MA): The 5-day Moving Average (MA) has been fluctuating around the closing prices, indicating short-term price trends. The Simple Moving Average (SMA) and Exponential Moving Average (EMA) show a slight uptrend.
- MACD: The Moving Average Convergence Divergence (MACD) has been negative but showing signs of convergence towards the signal line, suggesting a potential reversal.
- MACD Histogram: The MACD Histogram is positive, indicating a bullish momentum.
Momentum Analysis:
- RSI: The Relative Strength Index (RSI) has been oscillating around the neutral level, indicating a balanced momentum.
- Stochastic Oscillator: Both %K and %D levels of the Stochastic Oscillator have been declining, signaling a potential bearish momentum.
- Williams %R: The Williams %R is in the oversold territory, suggesting a possible reversal.
Volatility Analysis:
- Bollinger Bands (BB): The Bollinger Bands are narrowing, indicating decreasing volatility and a potential price breakout.
- Bollinger %B: The %B indicator is below 1, suggesting the price is below the lower band and potentially oversold.
Volume Analysis:
- On-Balance Volume (OBV): The OBV has been declining, indicating selling pressure and potential bearish sentiment.
- Chaikin Money Flow (CMF): The CMF is negative, suggesting outflow of money from the stock.
Key Observations and Opinions:
- Trend: The trend indicators show a mixed picture with a slight bullish bias in the short term.
- Momentum: Momentum indicators suggest a neutral to bearish sentiment in the market.
- Volatility: Volatility is decreasing, indicating a potential price breakout in the near future.
- Volume: The declining OBV and negative CMF point towards bearish pressure in the stock.
Conclusion:
Based on the analysis of the technical indicators, the stock price of GNTA is likely to experience further downward movement in the next few days. The bearish momentum indicated by the Stochastic Oscillator and Williams %R, coupled with the negative OBV and CMF, suggests a potential continuation of the current downtrend. Traders and investors should exercise caution and consider short-term selling strategies or wait for a clear reversal signal before considering long positions.