Technical Analysis of GMM 2024-05-10
Overview:
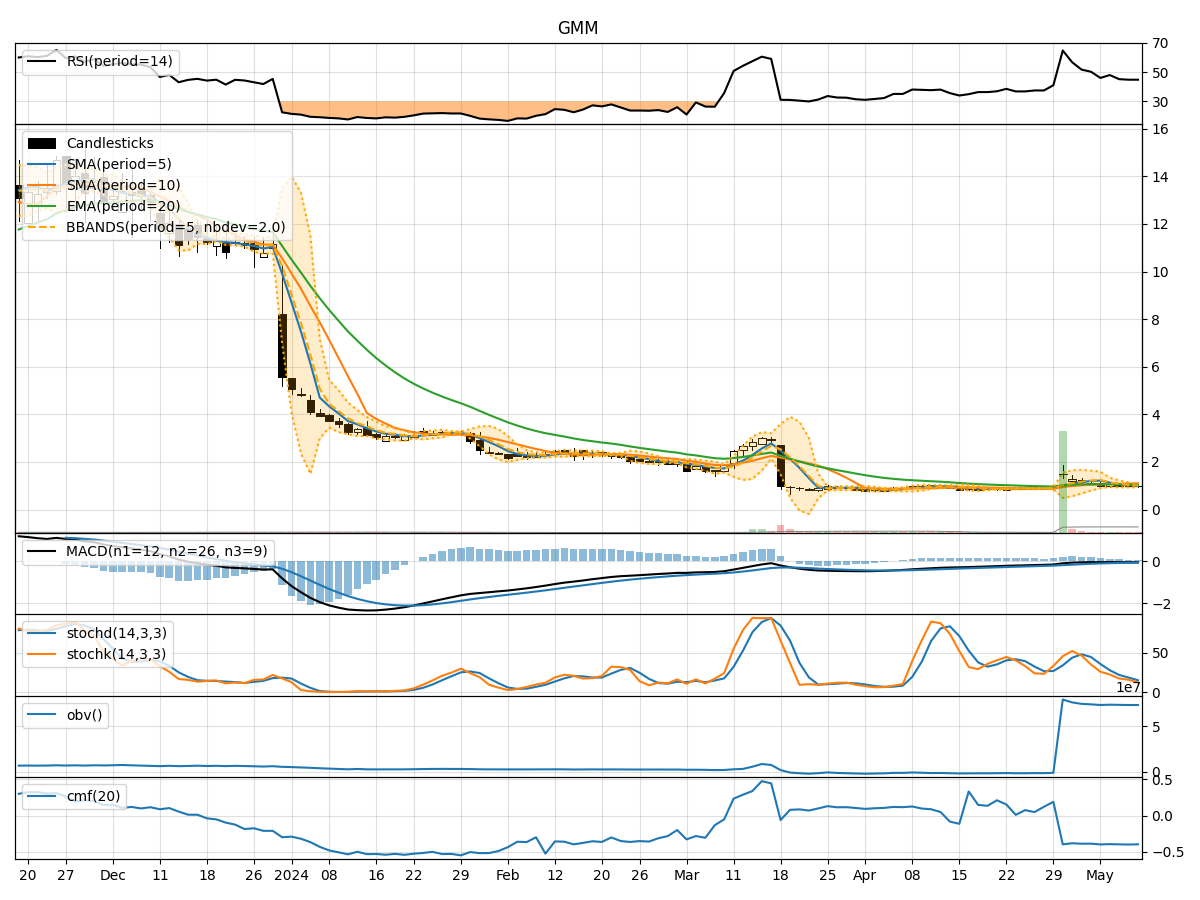
In analyzing the technical indicators for GMM stock over the last 5 days, we will delve into the trends, momentum, volatility, and volume indicators to provide a comprehensive outlook on the possible stock price movement in the coming days. By examining key metrics such as moving averages, MACD, RSI, Bollinger Bands, and OBV, we aim to offer valuable insights and predictions for potential price action.
Trend Indicators:
- Moving Averages (MA): The 5-day MA has been consistently below the closing prices, indicating a downward trend.
- MACD: The MACD line has been negative, suggesting bearish momentum.
- EMA: The EMA has been declining, further supporting the bearish trend.
Momentum Indicators:
- RSI: The RSI has been hovering around the mid-range, indicating a lack of strong momentum in either direction.
- Stochastic Oscillator: Both %K and %D have been decreasing, signaling weakening momentum.
- Williams %R: The indicator has been in oversold territory, suggesting a potential reversal.
Volatility Indicators:
- Bollinger Bands: The price has been consistently below the middle Bollinger Band, indicating a downtrend.
- Bollinger %B: The %B has been decreasing, reflecting lower volatility.
- Bollinger Band Width: The band width has been narrowing, suggesting reduced price fluctuations.
Volume Indicators:
- On-Balance Volume (OBV): The OBV has been relatively stable, indicating a balance between buying and selling pressure.
- Chaikin Money Flow (CMF): The CMF has been negative, suggesting outflow of money from the stock.
Key Observations and Opinions:
- Trend: The stock is in a clear downtrend based on moving averages and MACD.
- Momentum: Momentum indicators show weakening momentum and potential for a reversal.
- Volatility: Volatility has been decreasing, indicating a possible period of consolidation.
- Volume: The volume indicators suggest balanced buying and selling pressure with a slight negative bias.
Conclusion:
Based on the analysis of the technical indicators, the next few days for GMM stock are likely to see further downside movement with a potential for sideways consolidation as the stock approaches oversold levels. Traders should exercise caution and consider waiting for a clearer signal before making any significant trading decisions.