Technical Analysis of GLSI 2024-05-31
Overview:
In analyzing the technical indicators for GLSI over the last 5 days, we will delve into the trend, momentum, volatility, and volume indicators to provide a comprehensive outlook on the possible stock price movement in the coming days. By examining these key aspects, we aim to offer valuable insights and predictions to guide your investment decisions.
Trend Analysis:
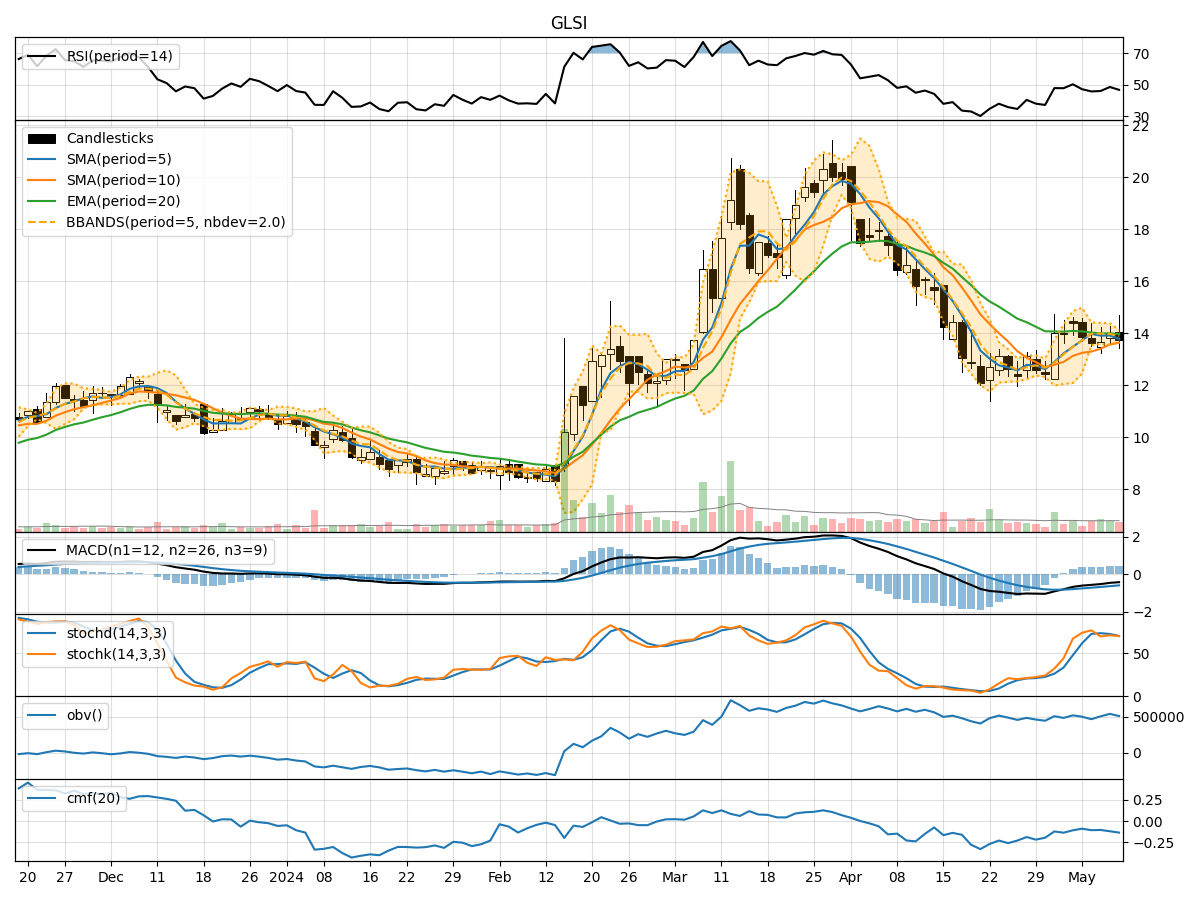
- Moving Averages (MA): The 5-day Moving Average (MA) has been fluctuating around the closing prices, indicating short-term price trends. The Simple Moving Average (SMA) and Exponential Moving Average (EMA) show a slight downward trend, with the EMA lagging behind.
- MACD: The Moving Average Convergence Divergence (MACD) has been negative, suggesting a bearish momentum in the stock price. The MACD Histogram (MACDH) has been positive but decreasing, indicating a potential reversal.
Momentum Analysis:
- RSI: The Relative Strength Index (RSI) has been hovering around the mid-range, indicating a neutral momentum in the stock. There is no clear overbought or oversold signal.
- Stochastic Oscillator: Both %K and %D of the Stochastic Oscillator are in the neutral zone, suggesting a lack of strong momentum in either direction.
- Williams %R: The Williams %R is close to oversold levels, indicating a potential buying opportunity.
Volatility Analysis:
- Bollinger Bands (BB): The Bollinger Bands have been narrowing, indicating decreasing volatility in the stock price. The bands are squeezing, which could lead to a breakout in either direction.
- Bollinger %B: The %B indicator is below 1, suggesting the stock is trading below the lower Bollinger Band, indicating a possible oversold condition.
Volume Analysis:
- On-Balance Volume (OBV): The OBV has been fluctuating, indicating a balance between buying and selling pressure. There is no clear accumulation or distribution signal.
- Chaikin Money Flow (CMF): The CMF has been negative, indicating a lack of buying pressure in the stock.
Conclusion:
Based on the analysis of the technical indicators, the stock price of GLSI is currently consolidating with sideways movement. The trend indicators show a slight bearish bias, while the momentum indicators suggest neutral momentum with a potential buying opportunity indicated by the Williams %R. The volatility is decreasing, indicating a possible breakout in the near future. The volume indicators reflect a balance between buying and selling pressure.
Recommendation:
Considering the overall analysis, it is advisable to monitor the stock closely for a potential breakout from the consolidation phase. Traders may consider waiting for a clear trend confirmation before making any significant trading decisions. Long-term investors may use this consolidation phase as an opportunity to accumulate the stock at favorable levels. It is essential to set stop-loss levels to manage risk effectively in case of unexpected price movements.
Disclaimer:
This analysis is based solely on technical indicators and does not take into account fundamental factors that may impact the stock price. It is crucial to conduct thorough research and consider all aspects of investing before making any financial decisions.