Technical Analysis of GLPG 2024-05-10
Overview:
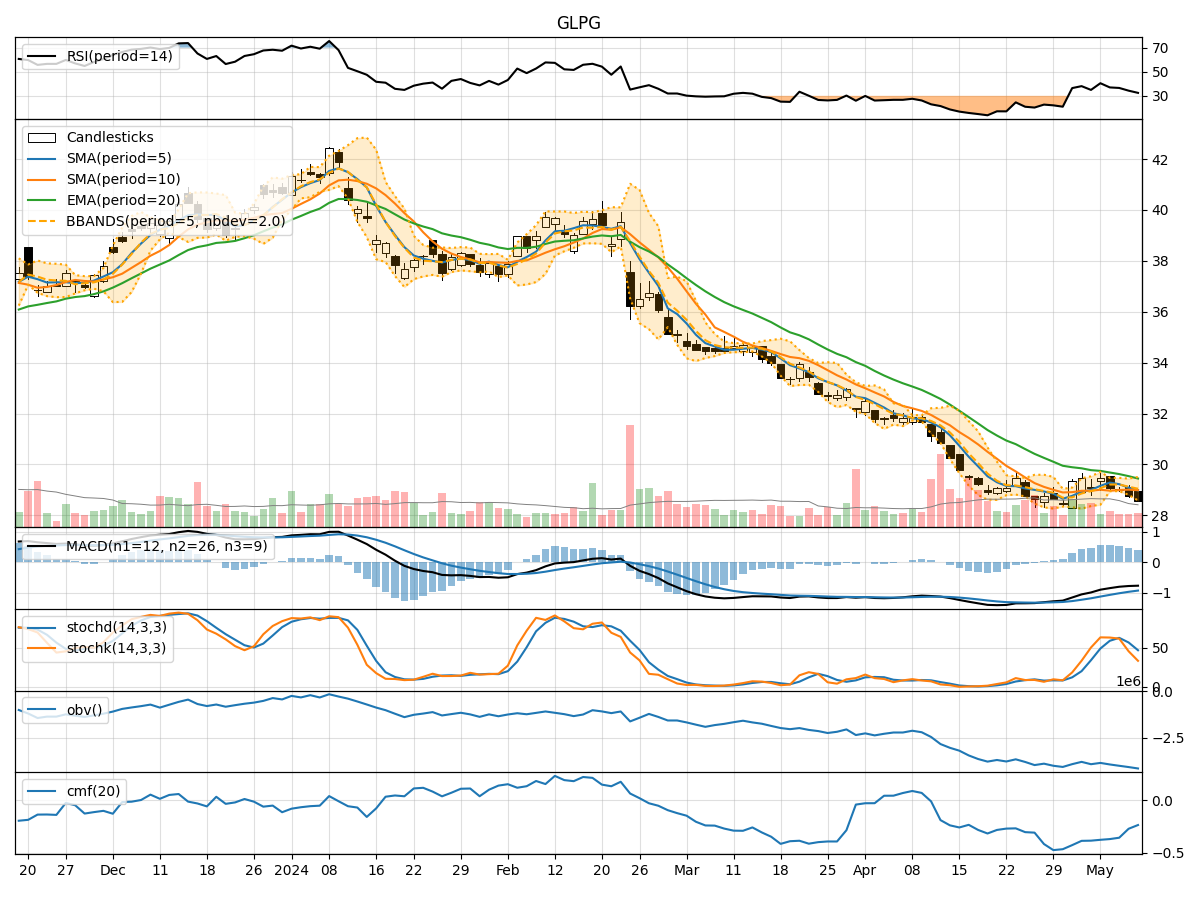
In analyzing the technical indicators for GLPG over the last 5 days, we will delve into the trend, momentum, volatility, and volume indicators to provide a comprehensive assessment of the stock's potential price movement. By examining these key factors, we aim to offer valuable insights and predictions for the upcoming days.
Trend Indicators:
- Moving Averages (MA): The 5-day MA has been fluctuating around the closing prices, indicating short-term price trends. The SMA(10) and EMA(20) show a slight downward trend, suggesting a weakening momentum.
- MACD and Signal Line: The MACD has been negative, with the MACD line consistently below the signal line, signaling a bearish trend.
- Conclusion: The trend indicators point towards a bearish outlook for GLPG in the short term.
Momentum Indicators:
- RSI: The RSI has been decreasing, indicating a loss in buying momentum and potential oversold conditions.
- Stochastic Oscillator: Both %K and %D have been declining, suggesting a bearish momentum.
- Williams %R: The indicator has been in the oversold territory, indicating a potential reversal.
- Conclusion: Momentum indicators support a bearish sentiment for GLPG in the near future.
Volatility Indicators:
- Bollinger Bands: The bands have been narrowing, indicating decreasing volatility and a potential price breakout.
- Conclusion: Volatility indicators suggest a consolidation phase for GLPG, with a possible breakout in price movement.
Volume Indicators:
- On-Balance Volume (OBV): The OBV has been declining, indicating selling pressure and potential bearish sentiment.
- Chaikin Money Flow (CMF): The CMF has been negative, suggesting outflow of money from the stock.
- Conclusion: Volume indicators align with a bearish stance for GLPG in the upcoming days.
Overall Conclusion:
Based on the analysis of trend, momentum, volatility, and volume indicators, the overall outlook for GLPG in the next few days is bearish. The stock is likely to experience continued downward pressure, with a potential breakout in price movement due to decreasing volatility. Traders and investors should exercise caution and consider short-term selling strategies or wait for a clear reversal signal before considering long positions.
Key Takeaways:
- The stock is in a downtrend based on moving averages and MACD.
- Momentum indicators suggest a bearish sentiment with potential oversold conditions.
- Volatility indicates a consolidation phase with a possible breakout.
- Volume indicators support a bearish outlook with selling pressure.
In conclusion, GLPG is expected to face downward pressure in the near future, and traders should be prepared for potential price declines. It is advisable to closely monitor key support levels and wait for confirmation of a trend reversal before considering long positions.