Technical Analysis of GLMD 2024-05-10
Overview:
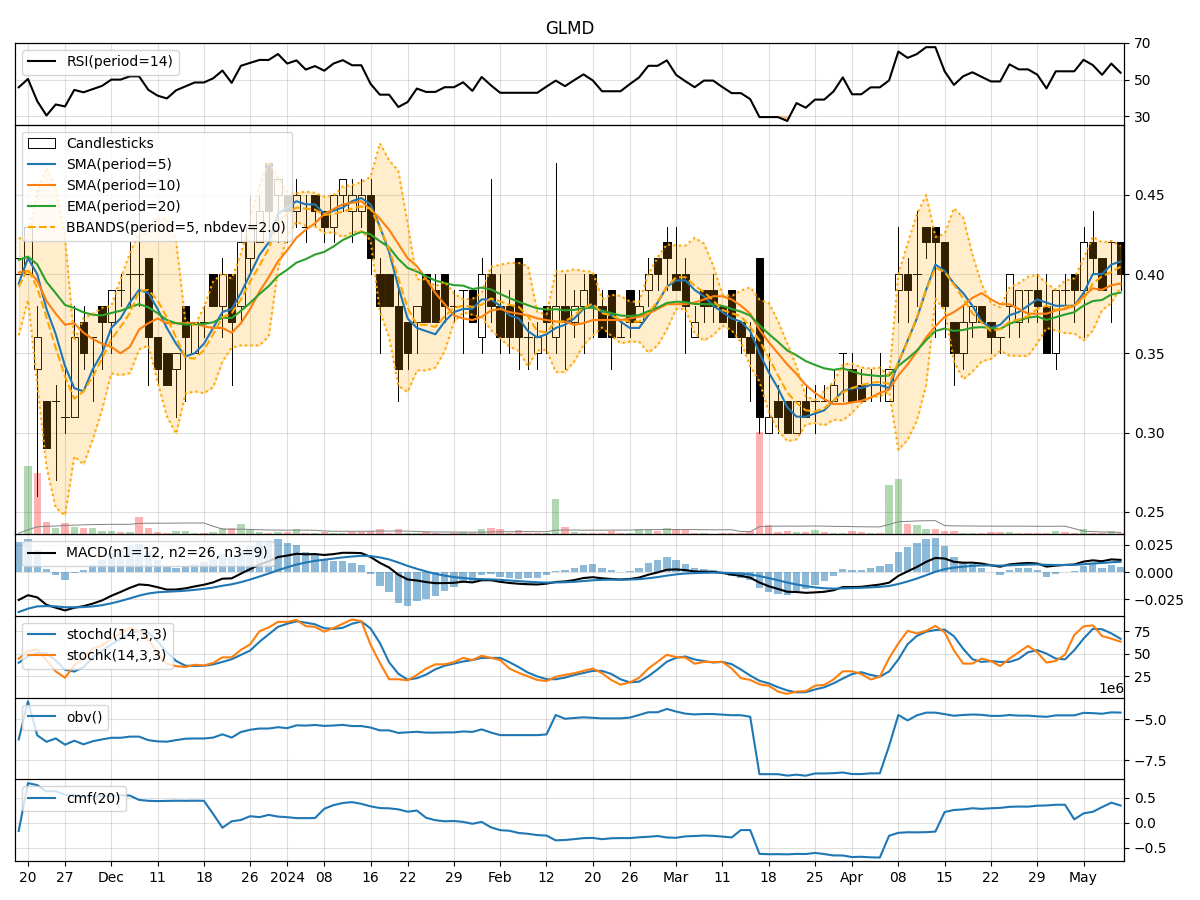
In analyzing the technical indicators for GLMD over the last 5 days, we will delve into the trend, momentum, volatility, and volume indicators to provide a comprehensive assessment of the stock's potential price movement. By examining these key factors, we aim to offer valuable insights and predictions for the next few days.
Trend Analysis:
- Moving Averages (MA): The 5-day Moving Average (MA) has been consistently above the Simple Moving Average (SMA) and Exponential Moving Average (EMA), indicating a bullish trend.
- MACD: The MACD line has been consistently above the signal line, suggesting positive momentum in the stock price.
Momentum Analysis:
- RSI: The Relative Strength Index (RSI) has been fluctuating around the 50 level, indicating a neutral momentum in the stock.
- Stochastic Oscillator: The Stochastic Oscillator shows mixed signals with values fluctuating between overbought and oversold levels.
Volatility Analysis:
- Bollinger Bands (BB): The Bollinger Bands have shown narrowing volatility, with the stock price approaching the lower band, indicating a potential reversal or consolidation.
Volume Analysis:
- On-Balance Volume (OBV): The OBV has been relatively stable, indicating consistent buying interest in the stock.
- Chaikin Money Flow (CMF): The CMF has been positive, suggesting that money is flowing into the stock.
Key Observations:
- The trend indicators suggest a bullish sentiment in the short term.
- Momentum indicators show mixed signals, indicating a lack of clear direction.
- Volatility has been decreasing, potentially signaling a period of consolidation.
- Volume indicators point towards consistent buying interest in the stock.
Conclusion:
Based on the analysis of the technical indicators, the next few days for GLMD could see sideways movement or consolidation as the stock price hovers around current levels. While the trend indicators remain bullish, the mixed signals from momentum indicators and decreasing volatility suggest a period of indecision in the market. Traders may consider staying cautious and monitoring key support and resistance levels for potential breakout opportunities.