Technical Analysis of GLBS 2024-05-10
Overview:
In analyzing the technical indicators for GLBS over the last 5 days, we will delve into the trend, momentum, volatility, and volume indicators to provide a comprehensive outlook on the possible stock price movement in the coming days.
Trend Analysis:
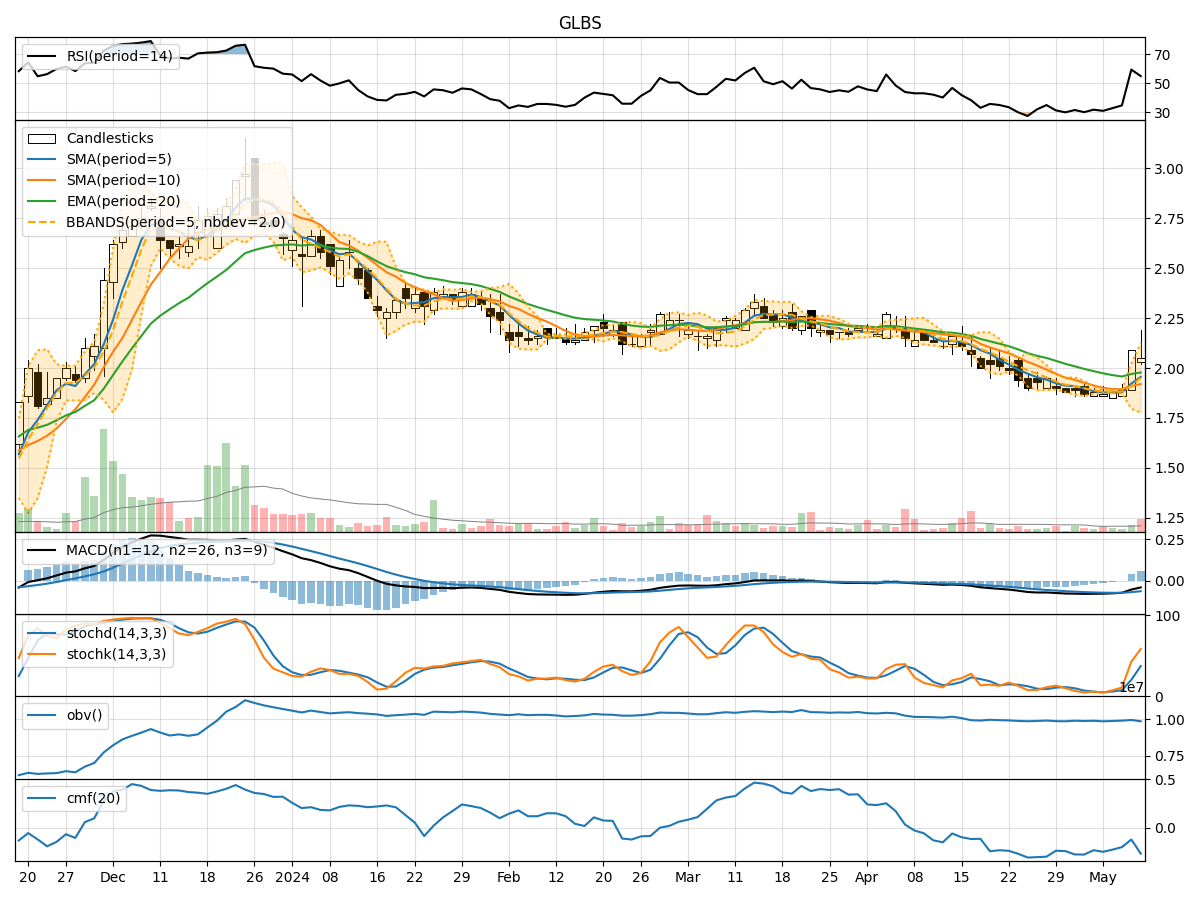
- Moving Averages (MA): The 5-day Moving Average (MA) has been relatively stable around the $1.87-$1.96 range, indicating a sideways trend.
- MACD: The Moving Average Convergence Divergence (MACD) has shown a slight improvement from negative values towards zero, suggesting a potential shift in momentum.
Momentum Analysis:
- RSI: The Relative Strength Index (RSI) has been fluctuating between oversold and neutral levels, currently around 55, indicating a balanced momentum.
- Stochastic Oscillator: Both %K and %D have been rising, indicating increasing buying pressure and potential upward momentum.
Volatility Analysis:
- Bollinger Bands (BB): The Bollinger Bands have widened, suggesting increased volatility in the stock price.
Volume Analysis:
- On-Balance Volume (OBV): The OBV has shown a mixed trend, indicating some distribution of shares.
- Chaikin Money Flow (CMF): The CMF has been negative, reflecting selling pressure in the stock.
Key Observations:
- The stock has been trading in a sideways pattern with some signs of potential momentum shift.
- Volatility has increased, indicating potential price swings in the coming days.
- The volume indicators suggest a mixed sentiment with some selling pressure.
Conclusion:
Based on the analysis of the technical indicators, the stock of GLBS is likely to experience increased volatility in the near term. The momentum is showing signs of a potential upward movement, supported by the rising Stochastic Oscillator. However, the mixed volume indicators and the negative CMF signal caution.
Recommendation:
Considering the overall analysis, there is a higher probability of the stock price experiencing upward movement in the next few days. Traders should closely monitor the price action and key support/resistance levels for potential entry and exit points. It is advisable to set stop-loss orders to manage risk effectively.