Technical Analysis of GHRS 2024-05-10
Overview:
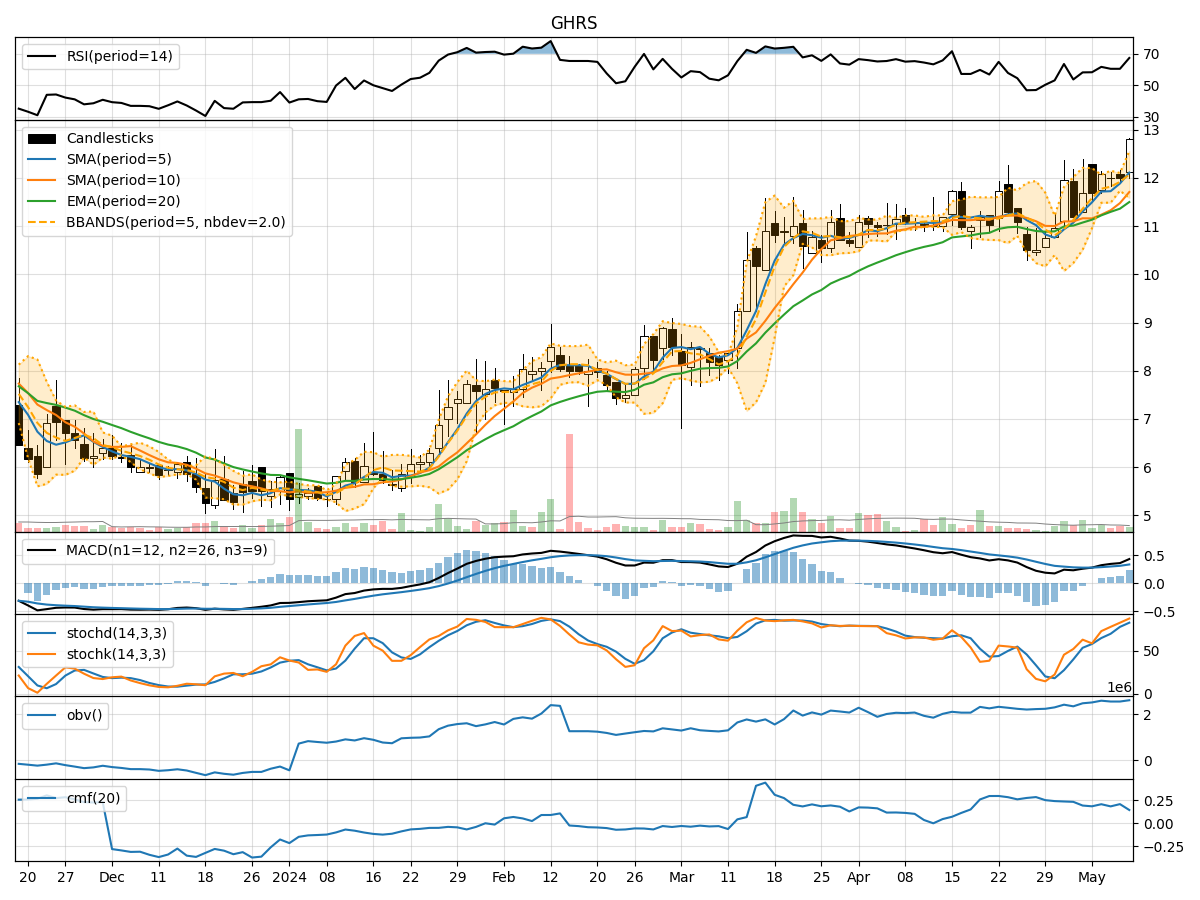
In analyzing the technical indicators for GHRS over the last 5 days, we will delve into the trend, momentum, volatility, and volume indicators to provide a comprehensive outlook on the possible stock price movement in the coming days.
Trend Analysis:
- Moving Averages (MA): The 5-day Moving Average has been consistently above the closing prices, indicating an upward trend.
- MACD: The MACD line has been above the signal line for the past 5 days, with both lines showing an upward trajectory, suggesting a bullish momentum.
- RSI: The Relative Strength Index has been hovering around 60-70, indicating positive momentum in the stock.
Momentum Analysis:
- Stochastic Oscillator: Both %K and %D have been in the overbought zone, suggesting that the stock may be overvalued in the short term.
- Williams %R: The Williams %R is close to the oversold territory, indicating a potential buying opportunity.
Volatility Analysis:
- Bollinger Bands: The stock price has been trading within the upper Bollinger Band, indicating high volatility in the short term.
- Volatility Percentage (BBP): The BBP is above 0.5, suggesting that the stock is currently trading at the upper end of its volatility range.
Volume Analysis:
- On-Balance Volume (OBV): The OBV has been relatively stable over the past 5 days, indicating consistent buying interest in the stock.
- Chaikin Money Flow (CMF): The CMF has been positive, indicating inflow of money into the stock.
Key Observations:
- The trend indicators suggest a strong bullish sentiment in the stock.
- Momentum indicators show a mixed signal with overbought stochastic levels and oversold Williams %R.
- Volatility indicators point towards high volatility in the short term.
- Volume indicators indicate consistent buying interest in the stock.
Conclusion:
Based on the analysis of the technical indicators, the next few days' possible stock price movement for GHRS is likely to be upward with high volatility. Traders should exercise caution due to the overbought stochastic levels, but the overall trend remains bullish. Consider potential pullbacks as buying opportunities in line with the upward trend.