Technical Analysis of GFAI 2024-05-10
Overview:
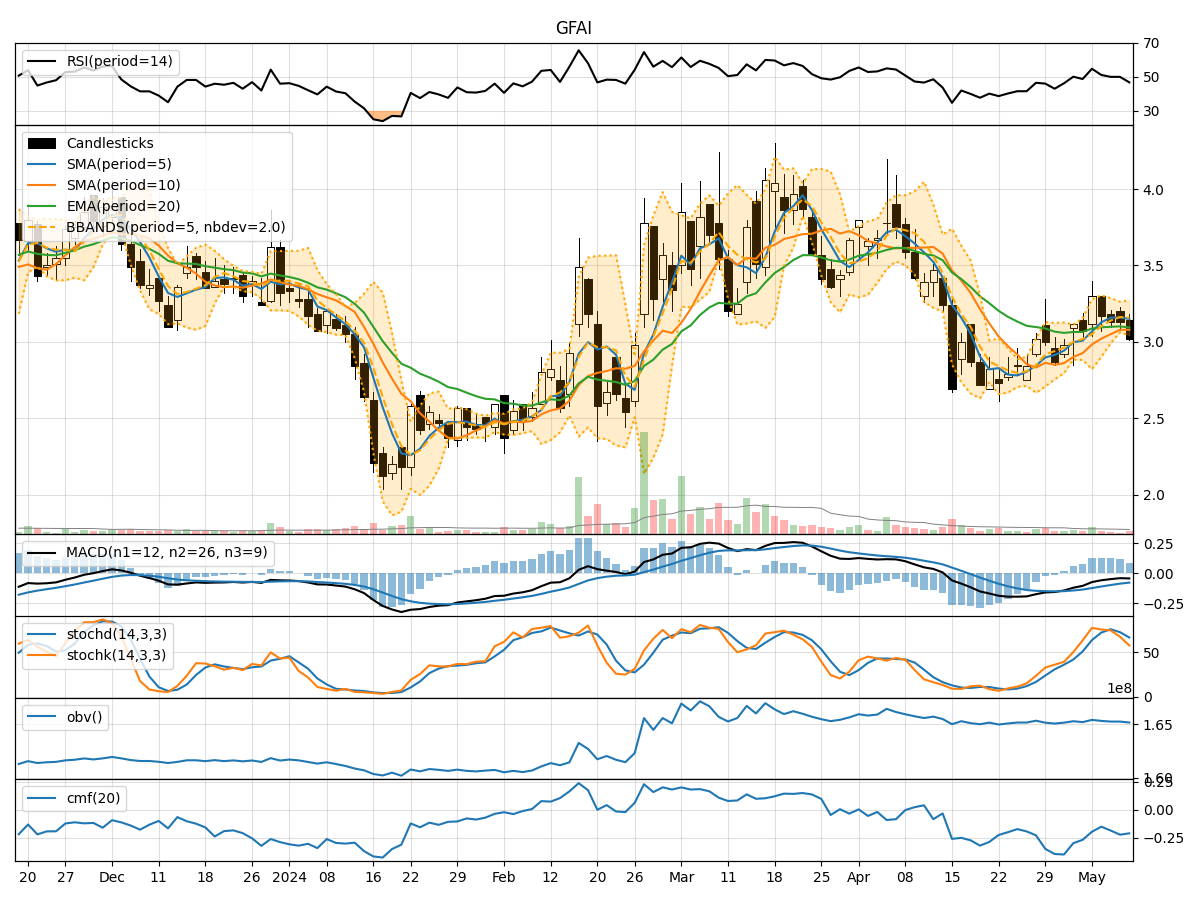
In analyzing the technical indicators for GFAI over the last 5 days, we will delve into the trend, momentum, volatility, and volume indicators to provide a comprehensive assessment of the stock's potential price movement. By examining key metrics such as moving averages, MACD, RSI, Bollinger Bands, and OBV, we aim to offer valuable insights and predictions for the next few days.
Trend Analysis:
- Moving Averages (MA): The 5-day MA has been fluctuating around the closing prices, indicating short-term price trends. The stock has been trading close to the 5-day MA.
- MACD: The MACD line has been consistently below the signal line, suggesting a bearish trend in the short term.
- EMA: The EMA has been relatively stable, reflecting the recent price movements.
Momentum Analysis:
- RSI: The RSI has been hovering around the mid-level, indicating a neutral momentum in the stock.
- Stochastic Oscillator: Both %K and %D have been declining, signaling a potential bearish momentum.
- Williams %R: The stock has been in oversold territory based on the Williams %R indicator.
Volatility Analysis:
- Bollinger Bands: The stock price has been trading within the Bollinger Bands, suggesting a period of consolidation.
- Bollinger %B: The %B indicator has been fluctuating around the mid-level, indicating a lack of strong trend direction.
Volume Analysis:
- On-Balance Volume (OBV): The OBV has been relatively flat, indicating a balance between buying and selling pressure.
- Chaikin Money Flow (CMF): The CMF has been negative, suggesting a net outflow of money from the stock.
Key Observations:
- The stock is currently exhibiting mixed signals across different indicators, with no clear trend direction.
- The momentum indicators suggest a slightly bearish sentiment, while the volatility indicators point towards consolidation.
- The volume indicators indicate a lack of significant buying or selling pressure.
Conclusion:
Based on the analysis of the technical indicators, the next few days for GFAI stock are likely to see sideways movement with a slight bearish bias. Traders should exercise caution and closely monitor key support and resistance levels for potential entry or exit points. It is advisable to wait for more definitive signals before taking significant trading positions.