Technical Analysis of GEN 2024-05-10
Overview:
In analyzing the technical indicators for GEN stock over the last 5 days, we will delve into the trend, momentum, volatility, and volume indicators to provide a comprehensive outlook on the possible stock price movement in the coming days. By examining these key indicators, we aim to offer valuable insights and predictions for potential investors.
Trend Analysis:
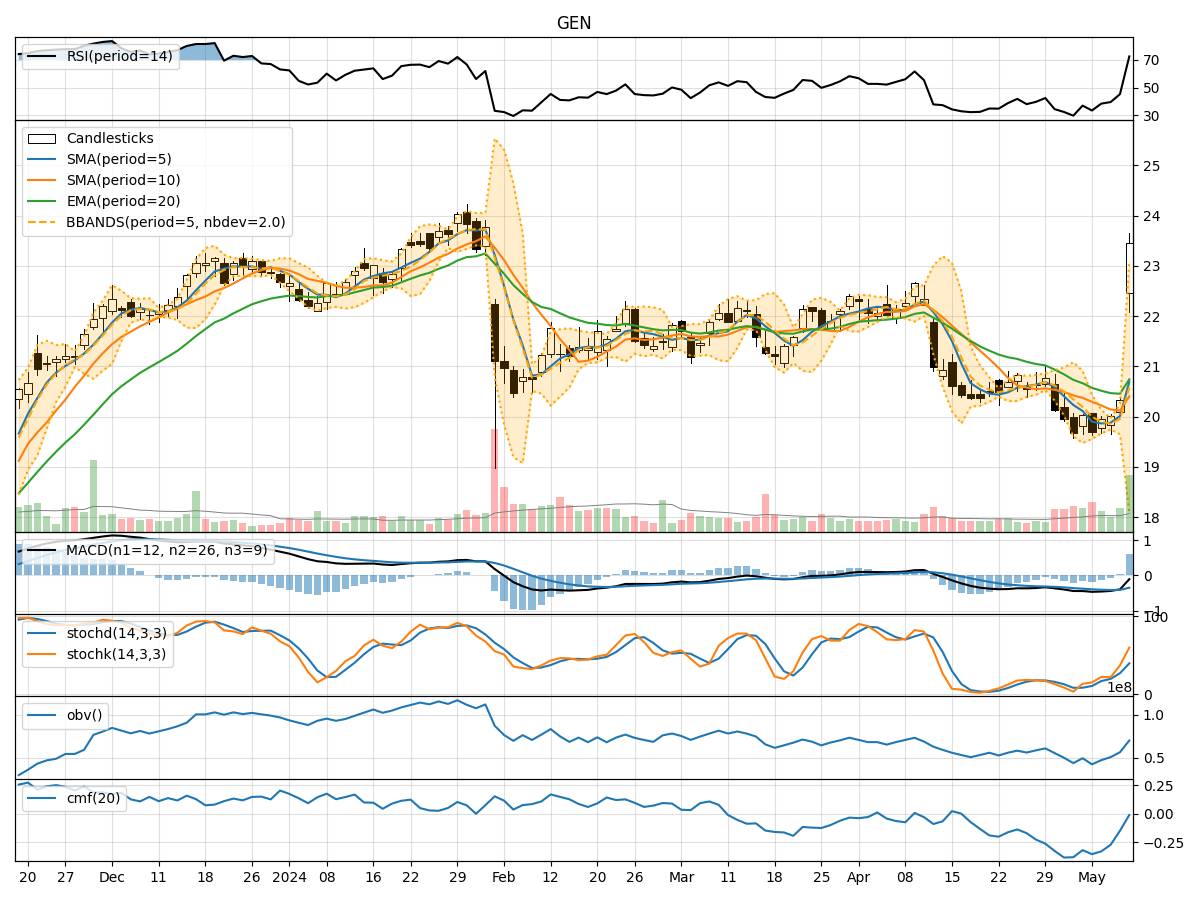
- Moving Averages (MA): The 5-day Moving Average (MA) has been fluctuating around the closing prices, indicating short-term price trends. The Simple Moving Average (SMA) and Exponential Moving Average (EMA) show a downward trend, suggesting a bearish sentiment.
- MACD: The Moving Average Convergence Divergence (MACD) and its signal line (MACDH) have been negative, indicating a bearish trend in the stock price.
Momentum Analysis:
- RSI: The Relative Strength Index (RSI) has been gradually increasing but remains below the overbought threshold, suggesting a neutral to slightly bullish momentum.
- Stochastic Oscillator: Both %K and %D lines of the Stochastic Oscillator are rising, indicating a bullish momentum shift.
Volatility Analysis:
- Bollinger Bands (BB): The Bollinger Bands are widening, indicating increased volatility in the stock price. The current price is near the upper band, suggesting a potential overbought condition.
Volume Analysis:
- On-Balance Volume (OBV): The OBV has shown a positive divergence, indicating accumulation by investors despite price fluctuations.
- Chaikin Money Flow (CMF): The CMF has been negative, suggesting a bearish money flow trend in the stock.
Key Observations:
- The trend indicators point towards a bearish sentiment with declining moving averages and negative MACD.
- Momentum indicators show a mixed signal with RSI indicating a neutral stance and Stochastic Oscillator signaling a bullish momentum.
- Volatility has increased, as seen in the widening Bollinger Bands, indicating potential price swings.
- Volume indicators suggest accumulation despite the bearish trend, as shown by OBV divergence.
Conclusion:
Based on the analysis of technical indicators, the stock price of GEN is likely to experience a short-term downward movement due to the bearish trend indicated by moving averages and MACD. However, the bullish momentum suggested by the Stochastic Oscillator could lead to temporary price rebounds. The increased volatility and negative money flow indicated by CMF also support a cautious outlook.
Recommendation: Considering the overall technical outlook, it is advisable to exercise caution in trading GEN stock in the coming days. Investors may consider waiting for clearer signals or implementing risk management strategies to navigate the potential price fluctuations.