Technical Analysis of GDEV 2024-05-10
Overview:
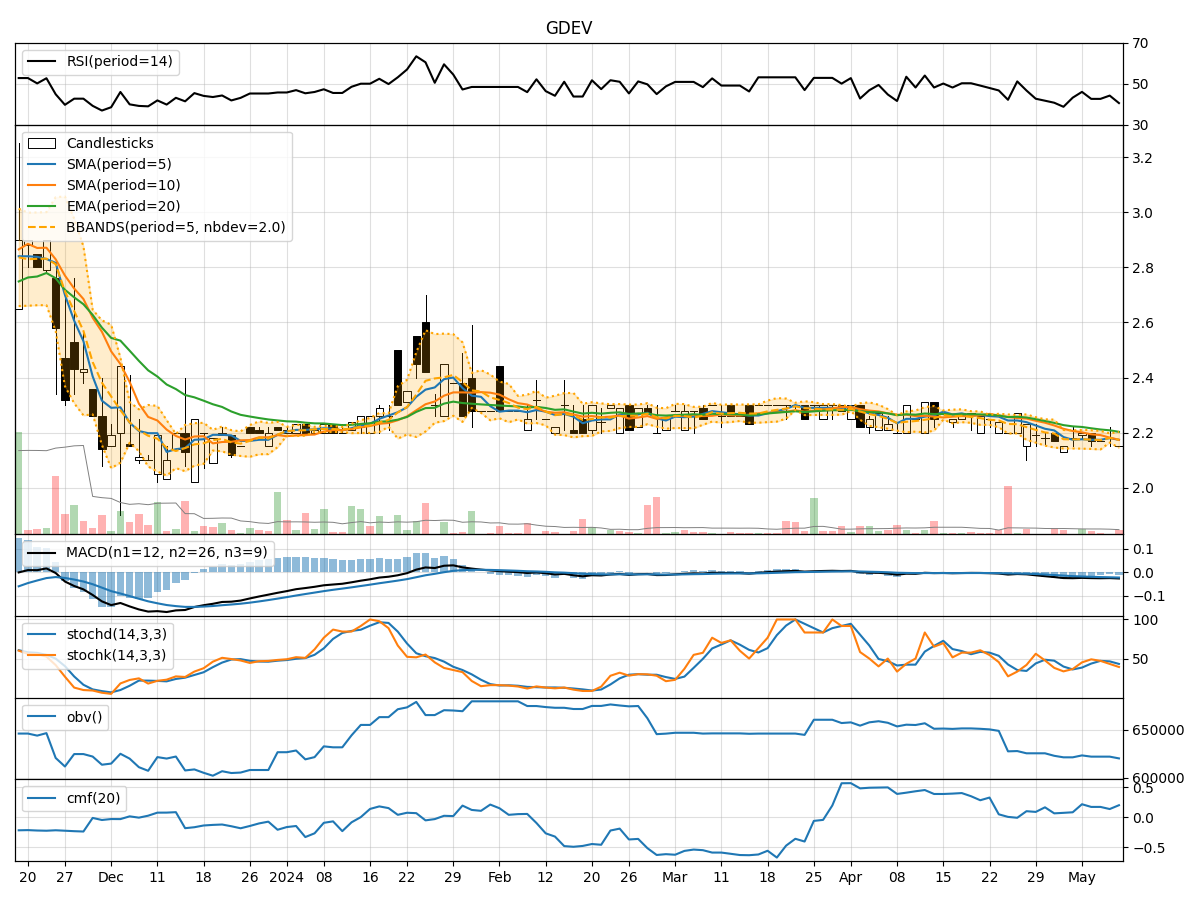
In analyzing the technical indicators for GDEV over the last 5 days, we will delve into the trend, momentum, volatility, and volume indicators to provide a comprehensive assessment of the stock's potential price movement. By examining these key factors, we aim to offer valuable insights and predictions for the next few days.
Trend Analysis:
- Moving Averages (MA): The 5-day moving average (MA) has been declining, indicating a short-term bearish trend.
- MACD: The MACD line has been consistently negative, suggesting a bearish momentum in the stock.
- EMA: The exponential moving average (EMA) has also been trending downwards, aligning with the bearish sentiment in the short term.
Key Observation: The trend indicators point towards a bearish outlook for GDEV in the short term.
Momentum Analysis:
- RSI: The Relative Strength Index (RSI) has been hovering around the mid-range, indicating a lack of strong momentum either bullish or bearish.
- Stochastic Oscillator: Both %K and %D have been fluctuating within a neutral zone, reflecting indecision in the market.
- Williams %R: The Williams %R is in oversold territory, suggesting a potential reversal or bounce in the stock price.
Key Observation: Momentum indicators signal a neutral stance with a slight inclination towards a potential bullish reversal.
Volatility Analysis:
- Bollinger Bands: The Bollinger Bands have been relatively narrow, indicating low volatility in the stock price.
- Bollinger %B: The %B indicator has been fluctuating around the middle band, reflecting a lack of clear direction.
- Average True Range (ATR): The ATR value has been low, suggesting minimal price fluctuations.
Key Observation: Volatility indicators suggest a period of consolidation or sideways movement in the stock.
Volume Analysis:
- On-Balance Volume (OBV): The OBV has been declining, indicating selling pressure in the stock.
- Chaikin Money Flow (CMF): The CMF has been relatively stable, showing a neutral flow of money in and out of the stock.
Key Observation: Volume indicators point towards a bearish sentiment with a lack of strong buying interest.
Conclusion:
Based on the analysis of the technical indicators, the next few days for GDEV are likely to see sideways movement with a slight bullish bias. While the trend indicators suggest a bearish outlook, the momentum indicators hint at a potential bullish reversal. The low volatility and lack of strong volume support the expectation of a period of consolidation. Traders should closely monitor key levels and wait for confirmation of a clear trend before making significant trading decisions.