Technical Analysis of GASS 2024-05-10
Overview:
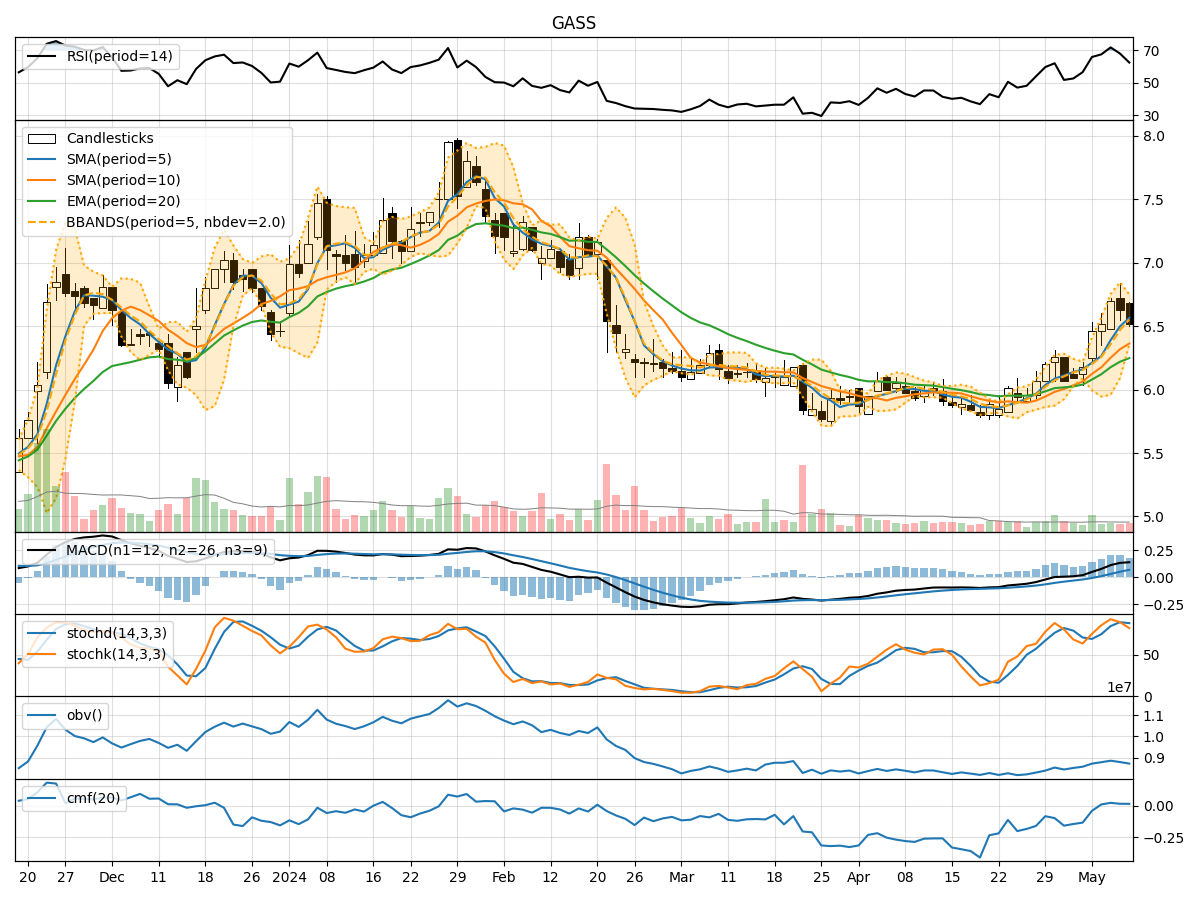
In analyzing the technical indicators for GASS over the last 5 days, we will delve into the trend, momentum, volatility, and volume indicators to provide a comprehensive outlook on the possible stock price movement in the coming days. By examining these key aspects, we aim to offer valuable insights and predictions for informed decision-making.
Trend Analysis:
- Moving Averages (MA): The 5-day MA has been consistently rising, indicating a bullish trend in the short term.
- MACD: The MACD line has been above the signal line, suggesting positive momentum.
- EMA: The EMA has been trending upwards, supporting the bullish sentiment.
Momentum Analysis:
- RSI: The RSI has been fluctuating but generally staying within the neutral to overbought range, suggesting a balanced momentum.
- Stochastic Oscillator: Both %K and %D have been in the overbought territory, indicating potential for a pullback.
- Williams %R: The indicator has been in the oversold region, signaling a possible reversal.
Volatility Analysis:
- Bollinger Bands (BB): The stock price has been trading within the bands, indicating moderate volatility.
- BB Width: The bands have been narrowing, suggesting a potential decrease in volatility.
- BB %B: The %B indicator has been fluctuating around the midpoint, reflecting a balanced market sentiment.
Volume Analysis:
- On-Balance Volume (OBV): The OBV has been declining, indicating selling pressure in the market.
- Chaikin Money Flow (CMF): The CMF has been positive, suggesting inflow of money into the stock.
Conclusion:
Based on the analysis of the technical indicators, the stock of GASS is likely to experience sideways movement in the next few days. The bullish trend indicated by moving averages and MACD may be countered by the overbought signals from the momentum indicators like Stochastic Oscillator and RSI. The narrowing Bollinger Bands and declining OBV further support the view of a potential consolidation phase. Therefore, it is advisable to closely monitor the price action and key support/resistance levels for any breakout or reversal signals before making trading decisions.