Technical Analysis of GAQ 2024-05-10
Overview:
In analyzing the technical indicators for GAQ over the last 5 days, we will delve into the trend, momentum, volatility, and volume indicators to provide a comprehensive outlook on the possible stock price movement in the coming days. By examining these key aspects, we aim to offer valuable insights and predictions for potential investors.
Trend Analysis:
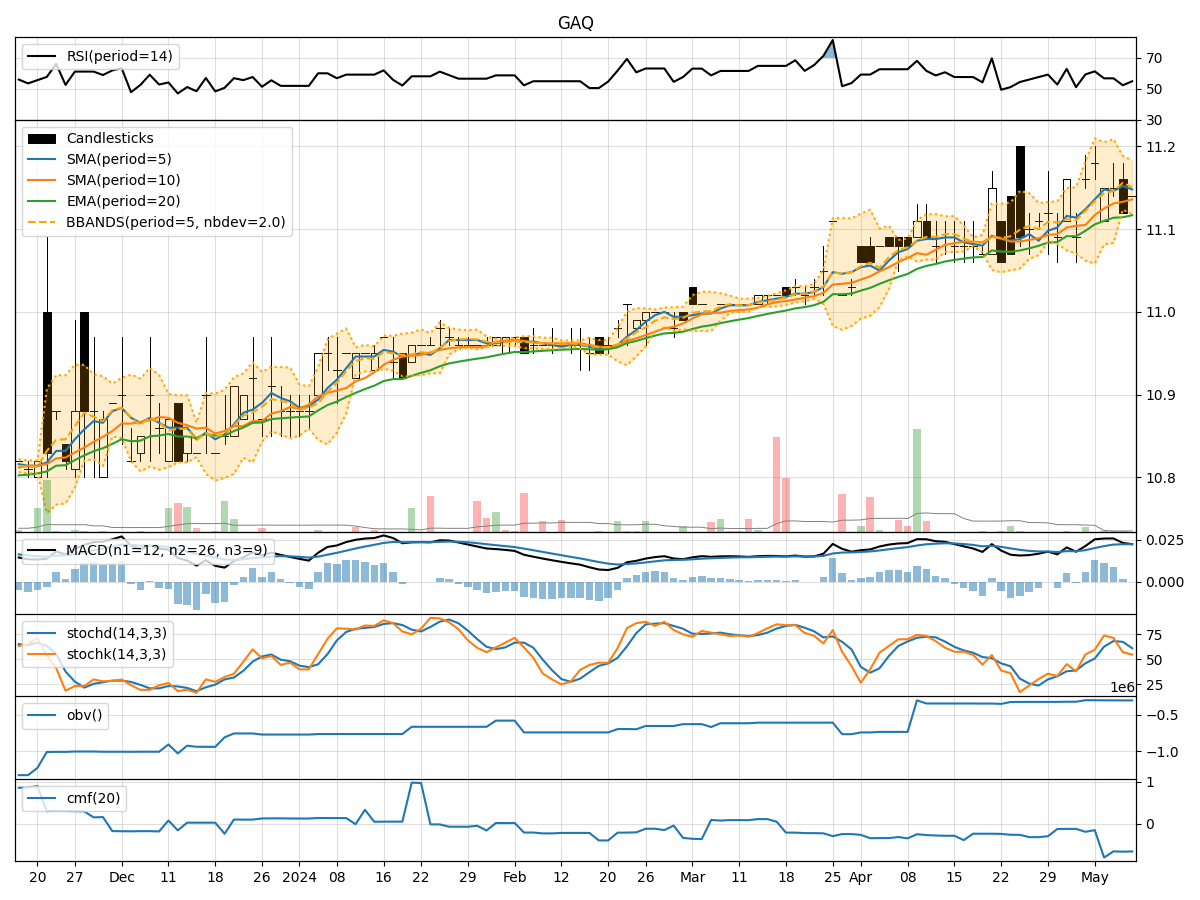
- Moving Averages (MA): The 5-day Moving Average (MA) has been relatively stable around the current price, indicating a neutral trend.
- MACD: The Moving Average Convergence Divergence (MACD) shows a slight positive momentum, with the MACD line consistently above the signal line.
- RSI: The Relative Strength Index (RSI) is hovering around the mid-level, suggesting a balanced momentum in the stock.
Momentum Analysis:
- Stochastic Oscillator: The Stochastic Oscillator indicates a neutral stance, with values fluctuating within a moderate range.
- Williams %R: The Williams %R reflects a slightly bearish sentiment, but not significantly extreme.
Volatility Analysis:
- Bollinger Bands: The Bollinger Bands are relatively narrow, indicating low volatility in the stock price movement.
- Average True Range (ATR): The ATR values suggest a stable price range over the past few days.
Volume Analysis:
- On-Balance Volume (OBV): The OBV has been relatively flat, indicating a balance between buying and selling pressure.
- Chaikin Money Flow (CMF): The CMF shows a negative trend, suggesting some selling pressure in the stock.
Key Observations:
- The stock is currently in a consolidation phase, with no clear trend direction indicated by the moving averages.
- Momentum indicators suggest a neutral to slightly bearish sentiment, with no strong signals of a trend reversal.
- Volatility is low, indicating a lack of significant price fluctuations.
- Volume indicators show a balance between buying and selling pressure, with a slight inclination towards selling.
Conclusion:
Based on the analysis of the technical indicators, the next few days for GAQ are likely to see sideways movement with a slight bearish bias. Investors should exercise caution and closely monitor any developments that could potentially shift the current market sentiment. It is advisable to wait for clearer signals of a trend before making significant trading decisions.