Technical Analysis of FUSN 2024-05-10
Overview:
In analyzing the technical indicators for FUSN over the last 5 days, we will delve into the trend, momentum, volatility, and volume indicators to provide a comprehensive outlook on the possible stock price movement in the coming days. By examining these key aspects, we aim to offer valuable insights and predictions to guide your investment decisions.
Trend Analysis:
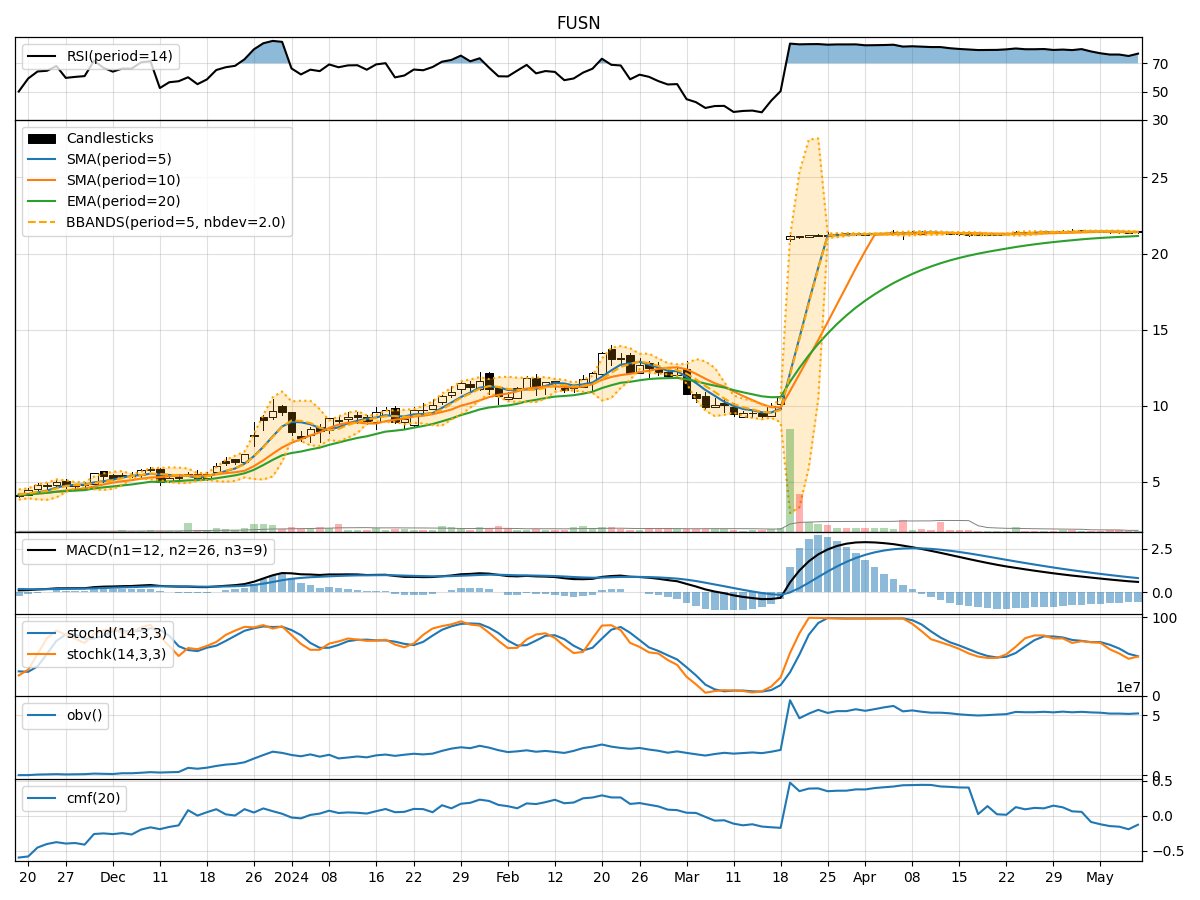
- Moving Averages (MA): The 5-day Moving Average (MA) has been relatively stable around the $21.42 mark, indicating a neutral trend in the short term.
- MACD: The Moving Average Convergence Divergence (MACD) shows a positive value, suggesting a bullish momentum in the stock.
- EMA: The Exponential Moving Average (EMA) has been on an upward trajectory, indicating a positive trend in the stock price.
Key Observation: The trend indicators suggest a slightly bullish sentiment in the stock price.
Momentum Analysis:
- RSI: The Relative Strength Index (RSI) has been fluctuating around 75-77, indicating a slightly overbought condition but still within a bullish momentum.
- Stochastic Oscillator: Both %K and %D values of the Stochastic Oscillator are showing a slight upward trend, suggesting a potential continuation of the bullish momentum.
- Williams %R: The Williams %R is hovering around -40 to -50, indicating a neutral to slightly overbought condition.
Key Observation: Momentum indicators point towards a continuation of the bullish sentiment in the stock.
Volatility Analysis:
- Bollinger Bands (BB): The Bollinger Bands are relatively narrow, indicating low volatility in the stock price.
- Bollinger %B: The %B value is fluctuating around 0.2-0.9, suggesting a range-bound movement with occasional spikes in volatility.
Key Observation: Volatility indicators signal a period of consolidation or sideways movement in the stock price.
Volume Analysis:
- On-Balance Volume (OBV): The OBV has been relatively stable, indicating a balance between buying and selling pressure.
- Chaikin Money Flow (CMF): The CMF is negative, suggesting a slight outflow of money from the stock.
Key Observation: Volume indicators reflect a neutral stance with no significant accumulation or distribution patterns.
Conclusion:
Based on the analysis of the technical indicators, the next few days' possible stock price movement for FUSN is likely to be sideways or consolidating with a slightly bullish bias. The trend and momentum indicators support a continuation of the current bullish sentiment, while volatility and volume indicators suggest a period of consolidation with low volatility.
Key Conclusion: Expect the stock price to consolidate in the near term with a potential for a slight upward movement. It is advisable to closely monitor the trend and momentum indicators for any signs of a shift in market sentiment.