Technical Analysis of FUFU 2024-05-10
Overview:
In analyzing the technical indicators for FUFU stock over the last 5 days, we will delve into the trends, momentum, volatility, and volume indicators to provide a comprehensive outlook on the possible future stock price movement. By examining these key indicators, we aim to offer valuable insights and predictions for the upcoming trading days.
Trend Analysis:
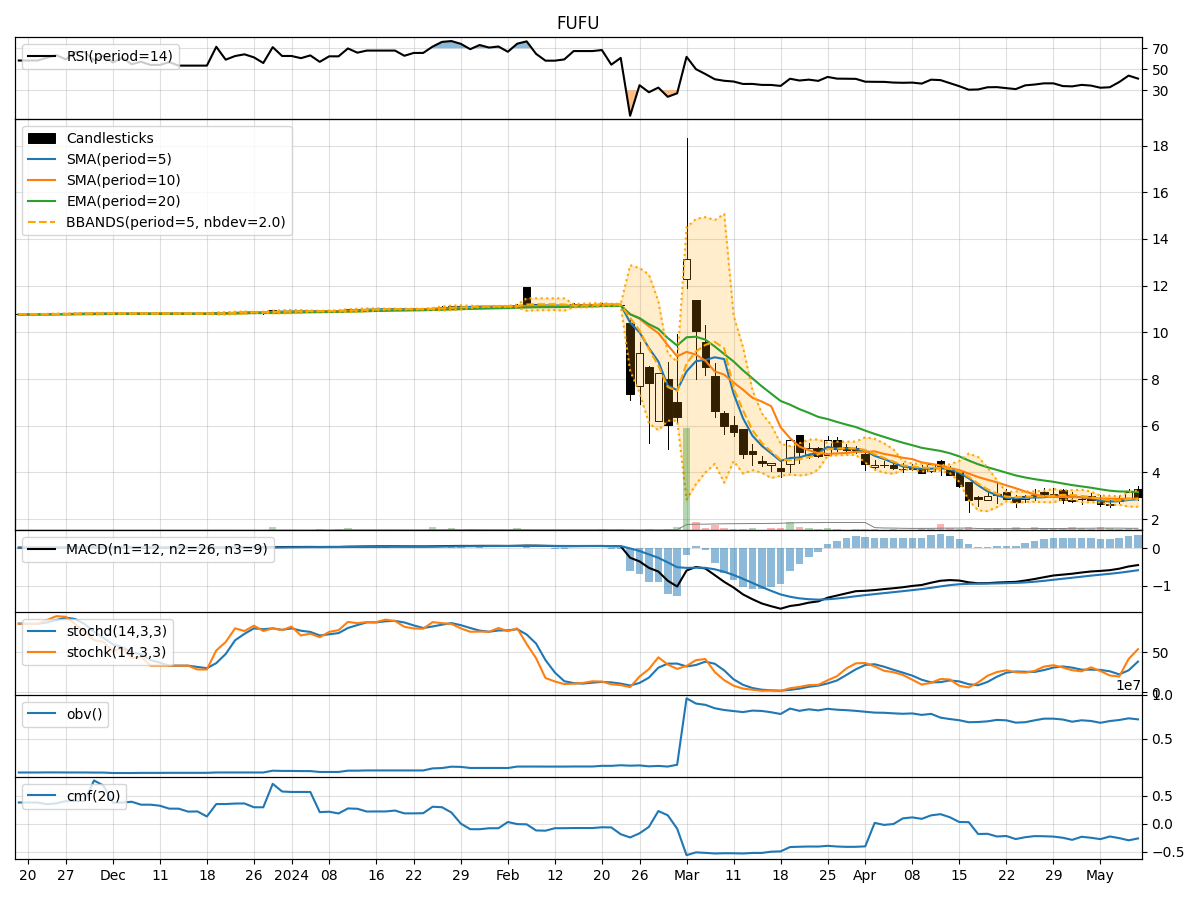
- Moving Averages (MA): The 5-day Moving Average (MA) has been fluctuating around the actual closing prices, indicating short-term price trends. The Simple Moving Average (SMA) and Exponential Moving Average (EMA) show a downward trend, suggesting a bearish sentiment.
- MACD: The Moving Average Convergence Divergence (MACD) and its signal line (MACDH) have been negative, indicating a potential bearish momentum in the stock price.
Momentum Analysis:
- RSI: The Relative Strength Index (RSI) has been below 50, indicating a bearish momentum in the stock.
- Stochastic Oscillator: Both %K and %D have been fluctuating, but recently %K has been above %D, suggesting a potential bullish reversal.
- Williams %R: The Williams %R is in the oversold territory, indicating a potential buying opportunity.
Volatility Analysis:
- Bollinger Bands (BB): The Bollinger Bands have been widening, indicating increased volatility in the stock price.
- Bollinger %B: The %B indicator has been fluctuating, suggesting potential buying or selling opportunities based on the band's width.
Volume Analysis:
- On-Balance Volume (OBV): The OBV has been fluctuating, indicating mixed buying and selling pressure in the stock.
- Chaikin Money Flow (CMF): The CMF has been negative, indicating a bearish money flow in the stock.
Key Observations:
- The trend indicators suggest a bearish sentiment in the short term.
- Momentum indicators show mixed signals, with a potential bullish reversal in the stochastic oscillator.
- Volatility has been increasing, indicating potential price swings.
- Volume indicators reflect mixed buying and selling pressure.
Conclusion:
Based on the analysis of the technical indicators, the stock price of FUFU is likely to experience further downward movement in the short term. The bearish trend indicated by moving averages and MACD, coupled with the negative RSI and CMF, suggests a bearish outlook. However, the potential bullish reversal in the stochastic oscillator warrants caution, as it may lead to temporary price rebounds. Traders should closely monitor the price action and key indicators for any signs of a trend reversal before making investment decisions.