Technical Analysis of FRHC 2024-05-10
Overview:
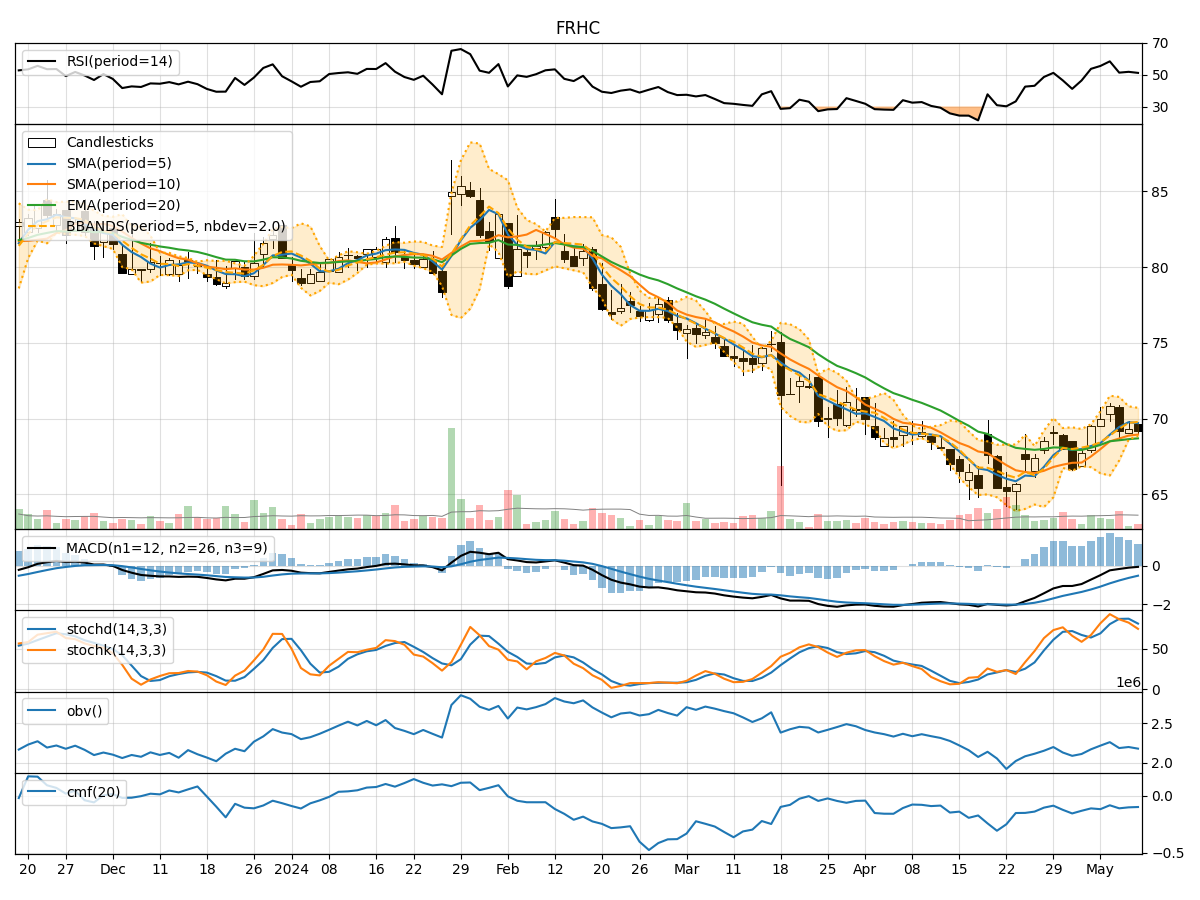
In analyzing the technical indicators for FRHC over the last 5 days, we will delve into the trend, momentum, volatility, and volume indicators to provide a comprehensive outlook on the possible stock price movement. By examining these key aspects, we aim to offer valuable insights and predictions for the upcoming days.
Trend Analysis:
- Moving Averages (MA): The 5-day Moving Average (MA) has been consistently above the Simple Moving Average (SMA) and Exponential Moving Average (EMA), indicating a short-term bullish trend.
- MACD: The MACD line has been below the signal line, suggesting a bearish momentum in the stock price.
- MACD Histogram: The MACD Histogram has been decreasing, indicating a weakening bearish momentum.
Momentum Analysis:
- RSI: The Relative Strength Index (RSI) has been fluctuating around the 50 level, indicating a neutral momentum.
- Stochastic Oscillator: Both %K and %D have been declining, signaling a bearish momentum.
- Williams %R: The Williams %R is in the oversold territory, suggesting a potential reversal in the stock price.
Volatility Analysis:
- Bollinger Bands (BB): The stock price has been trading within the Bollinger Bands, indicating a period of consolidation.
- Bollinger %B: The %B indicator is below 1, suggesting the stock price is trading below the lower band.
Volume Analysis:
- On-Balance Volume (OBV): The OBV has been decreasing, indicating a potential distribution phase.
- Chaikin Money Flow (CMF): The CMF has been negative, suggesting selling pressure in the stock.
Conclusion:
Based on the analysis of the technical indicators, the stock of FRHC is currently exhibiting mixed signals. The trend indicators suggest a short-term bullish bias, while the momentum indicators point towards a bearish sentiment. The volatility indicators indicate a period of consolidation, and the volume indicators show a potential distribution phase.
Overall View:
- Trend: Upward
- Momentum: Bearish
- Volatility: Consolidation
- Volume: Distribution
Recommendation:
Considering the conflicting signals from the indicators, it is advisable to exercise caution in trading FRHC in the upcoming days. Traders may consider waiting for more clarity in the price action before taking any significant positions. Keep a close watch on key support and resistance levels to gauge the stock's future direction accurately.