Technical Analysis of FRES 2024-05-10
Overview:
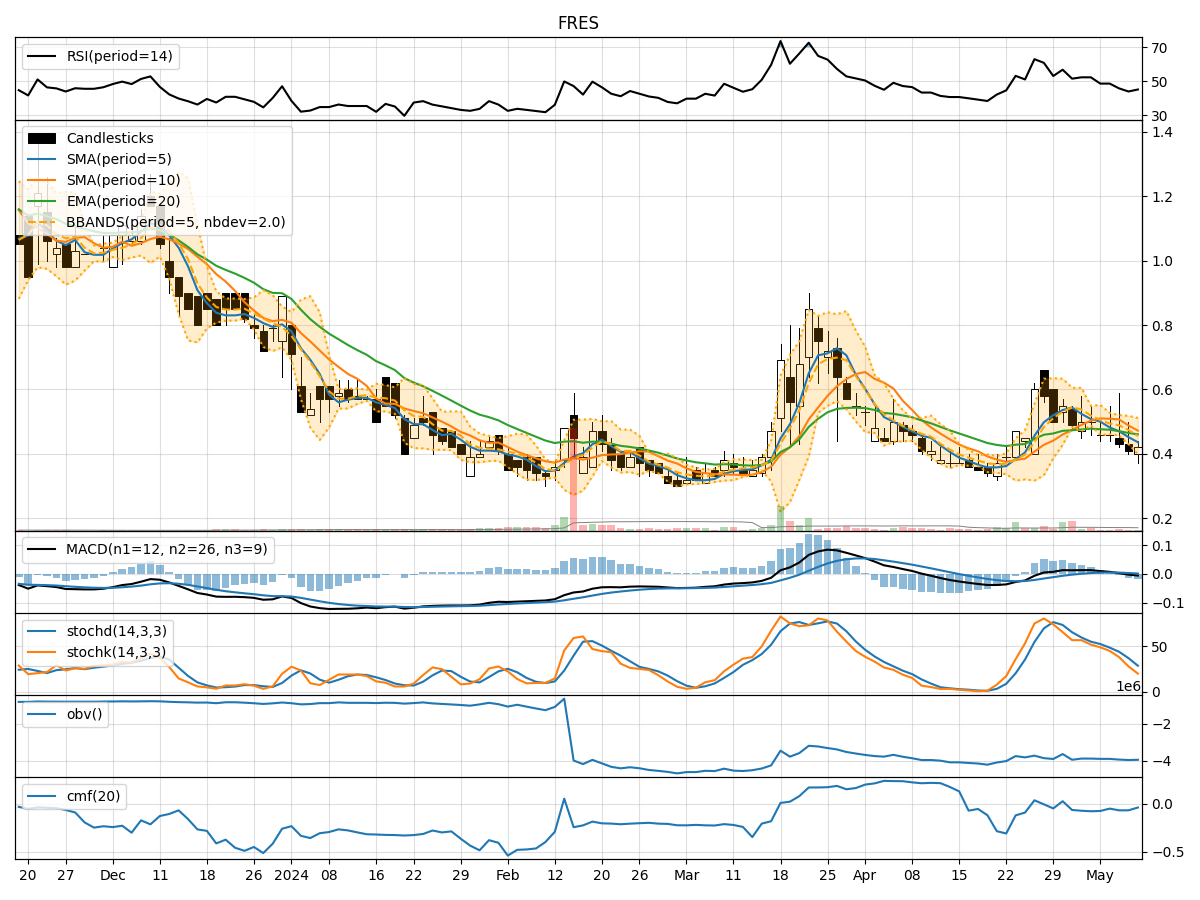
In analyzing the technical indicators for FRES over the last 5 days, we will delve into the trend, momentum, volatility, and volume indicators to provide a comprehensive assessment of the stock's potential price movement. By examining these key factors, we aim to offer valuable insights and predictions for the next few days.
Trend Analysis:
- Moving Averages (MA): The 5-day MA has been consistently below the closing price, indicating a downward trend.
- MACD: The MACD line has been below the signal line, suggesting bearish momentum.
- EMA: The Exponential Moving Average has been declining, further supporting the bearish trend.
Momentum Analysis:
- RSI: The Relative Strength Index has been hovering around the mid-level, indicating a lack of strong momentum in either direction.
- Stochastic Oscillator: Both %K and %D have been decreasing, signaling potential oversold conditions.
- Williams %R: The indicator has been in the oversold territory, suggesting a possible reversal.
Volatility Analysis:
- Bollinger Bands: The bands have been narrowing, indicating decreasing volatility.
- Bollinger %B: The %B indicator has been fluctuating within a range, reflecting consolidation.
- Average True Range (ATR): ATR has been decreasing, pointing towards reduced price fluctuations.
Volume Analysis:
- On-Balance Volume (OBV): The OBV has been declining, indicating selling pressure.
- Chaikin Money Flow (CMF): CMF has been negative, suggesting outflow of money from the stock.
Conclusion:
Based on the analysis of the technical indicators, the stock of FRES is currently in a bearish phase. The trend indicators, momentum oscillators, and volume indicators all point towards a downward trajectory. The narrowing Bollinger Bands and decreasing ATR indicate reduced volatility, possibly leading to a period of consolidation.
Forecast:
Given the current technical outlook, it is likely that FRES will continue its downward movement in the next few days. Traders and investors should exercise caution and consider short-term selling opportunities or wait for a clearer signal of a trend reversal before considering long positions. It is advisable to closely monitor key support levels and wait for confirmation from the indicators before making any significant trading decisions.