Technical Analysis of FOX 2024-05-10
Overview:
In analyzing the technical indicators for FOX stock over the last 5 days, we will delve into the trend, momentum, volatility, and volume indicators to provide a comprehensive outlook on the possible stock price movement in the coming days. By examining these key indicators, we aim to offer valuable insights and predictions for informed decision-making.
Trend Analysis:
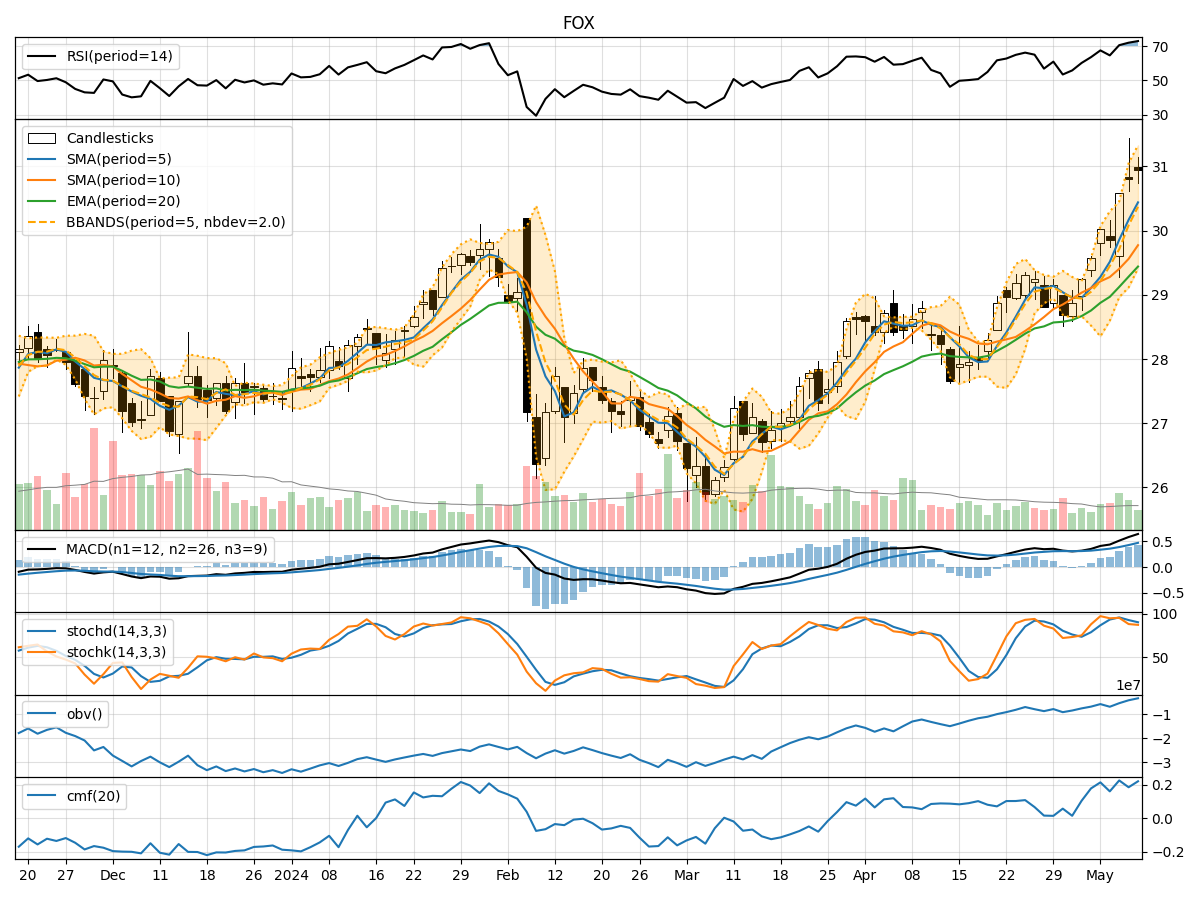
- Moving Averages (MA): The 5-day Moving Average (MA) has been consistently above the Simple Moving Average (SMA) and Exponential Moving Average (EMA), indicating a bullish trend.
- MACD: The MACD line has been consistently above the signal line, with both lines showing an upward trend, suggesting bullish momentum.
Momentum Analysis:
- RSI: The Relative Strength Index (RSI) has been in the overbought territory, indicating a strong bullish momentum.
- Stochastic Oscillator: Both %K and %D have been relatively high, suggesting an overbought condition.
Volatility Analysis:
- Bollinger Bands (BB): The stock price has been consistently trading above the middle Bollinger Band (BBM), indicating an upward trend with moderate volatility.
Volume Analysis:
- On-Balance Volume (OBV): The OBV has shown a consistent increase over the last 5 days, indicating strong buying pressure.
- Chaikin Money Flow (CMF): The CMF has also been positive, reflecting buying interest in the stock.
Key Observations:
- The trend indicators suggest a strong bullish sentiment with moving averages and MACD signaling an upward trend.
- Momentum indicators like RSI and Stochastic Oscillator indicate an overbought condition, potentially signaling a temporary pullback.
- Volatility remains moderate based on Bollinger Bands, indicating a steady price movement.
- Volume indicators show increasing buying pressure as seen in OBV and positive CMF, supporting the bullish outlook.
Conclusion:
Based on the analysis of the technical indicators, the next few days for FOX stock are likely to see continued upward movement. However, considering the overbought signals from momentum indicators, a short-term consolidation or minor pullback could be expected before the bullish trend resumes. Traders may consider buying on dips during potential pullbacks to capitalize on the overall bullish momentum. It is essential to monitor the price action closely and adjust strategies accordingly to navigate potential fluctuations in the market.