Technical Analysis of FNVT 2024-05-10
Overview:
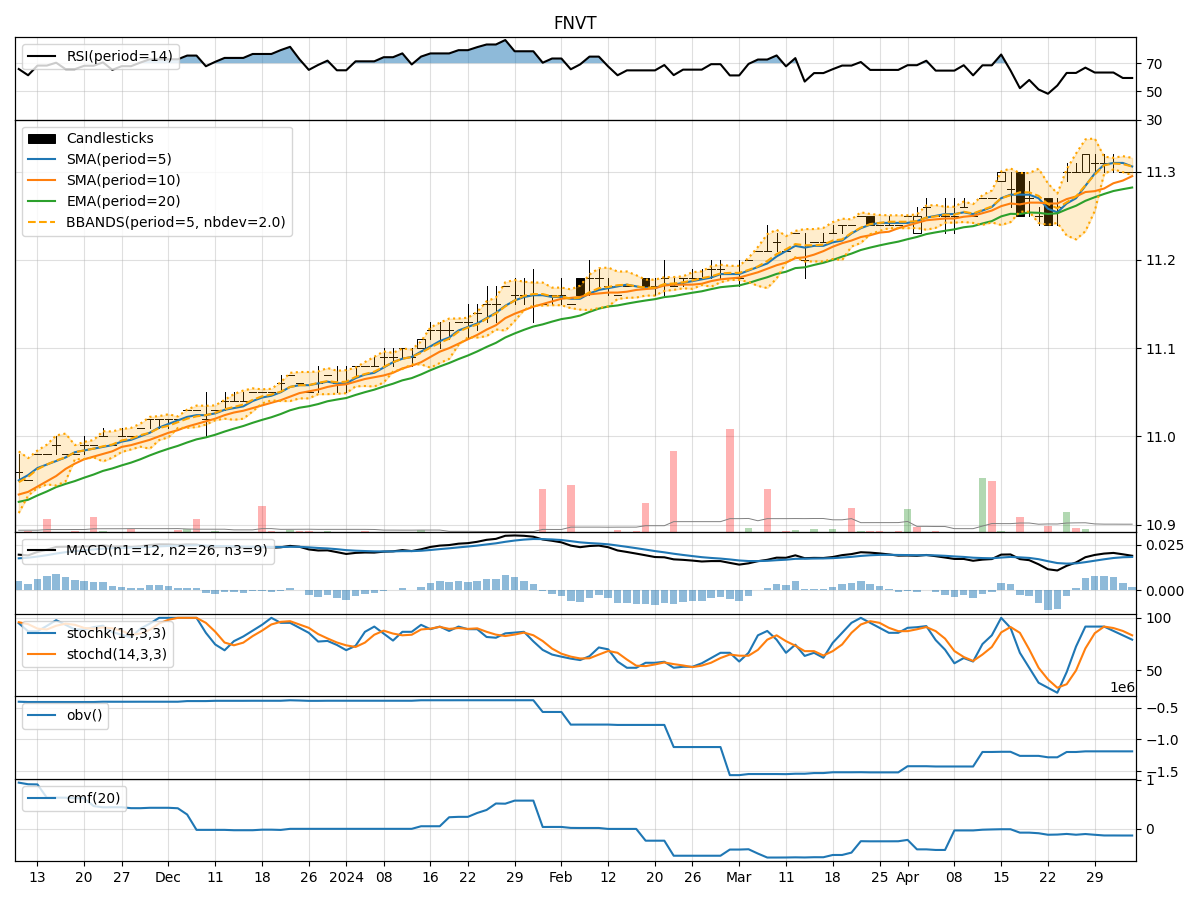
In analyzing the technical indicators for FNVT over the last 5 days, we will delve into the trend, momentum, volatility, and volume indicators to provide a comprehensive outlook on the possible stock price movement. By examining these key aspects, we aim to offer valuable insights and predictions for the upcoming days.
Trend Analysis:
- Moving Averages (MA): The 5-day Moving Average (MA) has been relatively stable around the current stock price, indicating a neutral trend.
- MACD: The Moving Average Convergence Divergence (MACD) shows a slight positive momentum, with the MACD line hovering above the signal line.
Momentum Analysis:
- RSI: The Relative Strength Index (RSI) has been fluctuating around the neutral zone, suggesting a lack of strong momentum.
- Stochastic Oscillator: Both %K and %D lines of the Stochastic Oscillator are in the overbought region, indicating a potential reversal.
Volatility Analysis:
- Bollinger Bands (BB): The Bollinger Bands are relatively narrow, indicating low volatility in the stock price.
Volume Analysis:
- On-Balance Volume (OBV): The OBV has been slightly negative, suggesting some distribution of the stock.
- Chaikin Money Flow (CMF): The CMF is also negative, indicating a bearish sentiment in the market.
Key Observations:
- The trend indicators suggest a neutral stance with a slight positive bias.
- Momentum indicators show a lack of strong momentum, potentially signaling a consolidation phase.
- Volatility is low, indicating a stable price movement.
- Volume indicators point towards a bearish sentiment with distribution of the stock.
Conclusion:
Based on the analysis of the technical indicators, the stock price of FNVT is likely to experience sideways movement in the next few days. The lack of strong momentum, coupled with bearish volume indicators, suggests a period of consolidation. Traders may expect the stock to trade within a narrow range without significant price fluctuations. It is advisable to closely monitor key support and resistance levels for potential breakout opportunities in the future.