Technical Analysis of FNGR 2024-05-10
Overview:
In analyzing the technical indicators for FNGR over the last 5 days, we will delve into the trend, momentum, volatility, and volume indicators to provide a comprehensive outlook on the possible stock price movement in the coming days. By examining these key aspects, we aim to offer valuable insights and recommendations for potential investors.
Trend Analysis:
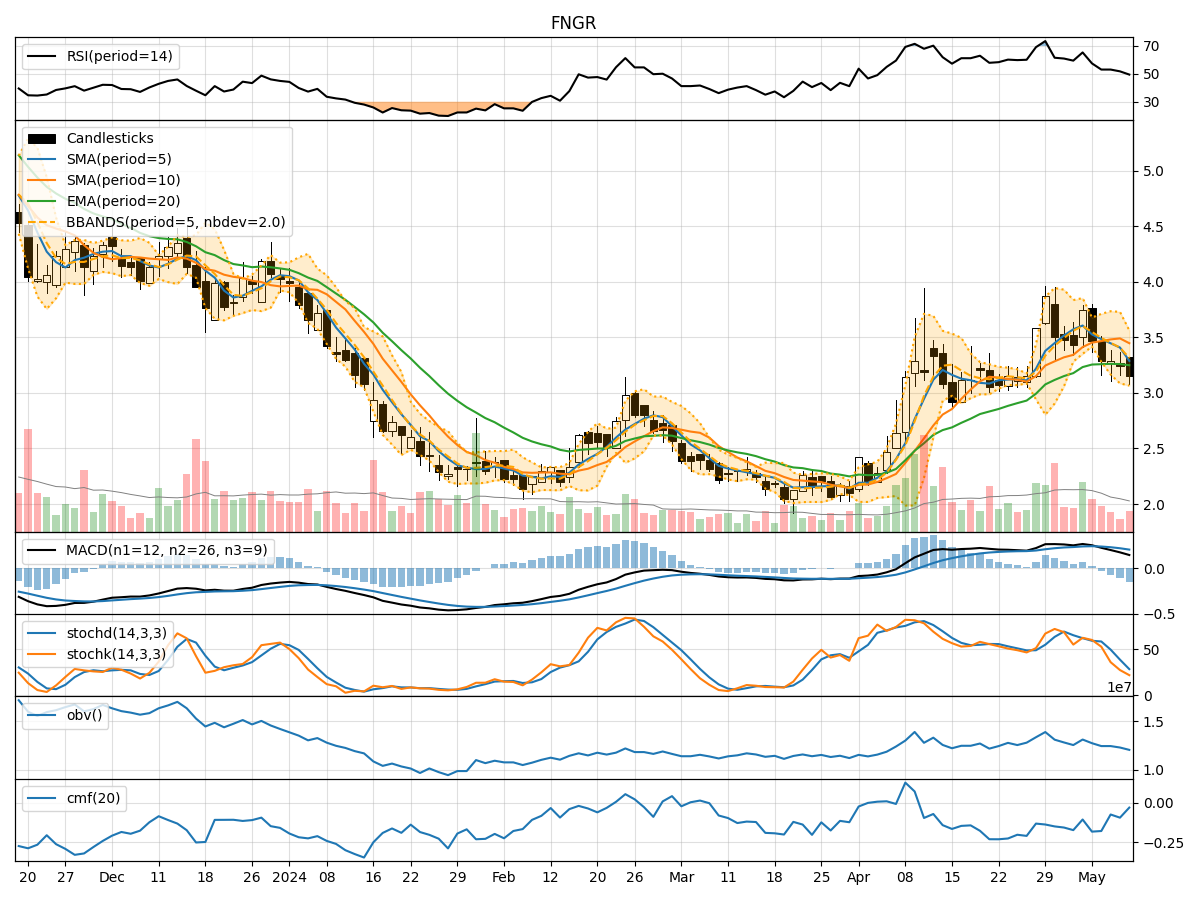
- Moving Averages (MA): The 5-day Moving Average (MA) has been declining, indicating a short-term bearish trend.
- MACD: The MACD line has been consistently positive, suggesting a bullish momentum.
- RSI: The Relative Strength Index (RSI) has been fluctuating around the neutral zone, indicating indecision in the market sentiment.
Momentum Analysis:
- Stochastic Oscillator: Both %K and %D have been decreasing, signaling a potential bearish momentum.
- Williams %R: The Williams %R is in oversold territory, suggesting a possible reversal in the short term.
Volatility Analysis:
- Bollinger Bands (BB): The Bollinger Bands have been narrowing, indicating decreasing volatility in the stock price.
- BB %B: The %B indicator is below 0.2, suggesting the stock is oversold.
Volume Analysis:
- On-Balance Volume (OBV): The OBV has been declining, indicating selling pressure in the stock.
- Chaikin Money Flow (CMF): The CMF is negative, suggesting outflow of money from the stock.
Key Observations:
- The trend indicators show a mixed signal with a bearish MA but a bullish MACD.
- Momentum indicators point towards a potential bearish momentum shift.
- Volatility indicators suggest decreasing volatility and oversold conditions.
- Volume indicators indicate selling pressure and negative money flow.
Conclusion:
Based on the analysis of the technical indicators, the stock price of FNGR is likely to experience a short-term downward movement. The bearish momentum indicated by the Stochastic Oscillator and oversold conditions highlighted by the Williams %R signal a potential price decline. Additionally, the negative OBV and CMF values suggest a lack of buying interest in the stock. Therefore, investors should exercise caution and consider waiting for a more favorable entry point before considering any long positions.