Technical Analysis of FMST 2024-05-10
Overview:
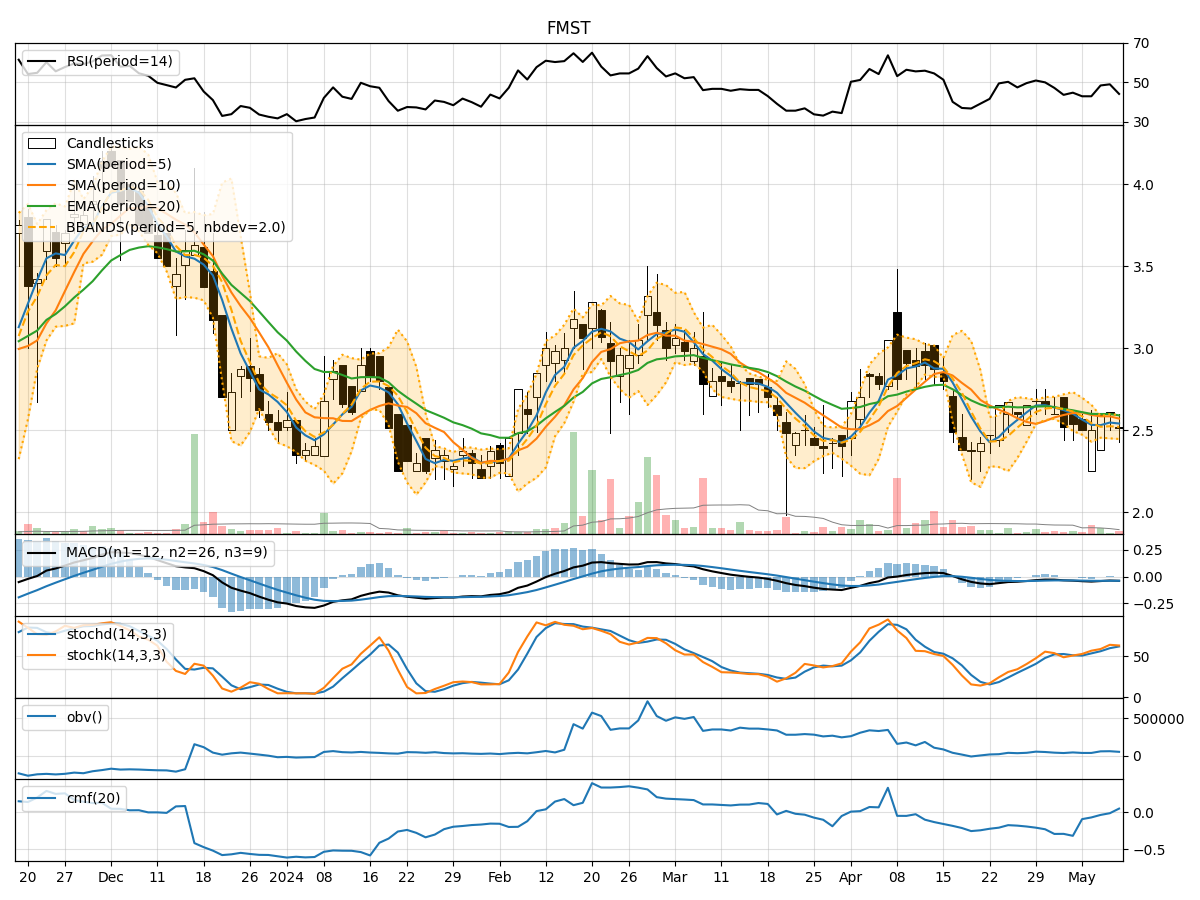
In the last 5 trading days, FMST stock has shown mixed signals across various technical indicators. The stock price has been fluctuating within a narrow range, indicating indecision in the market. To determine the possible future price movement, we will analyze the trend, momentum, volatility, and volume indicators in detail.
Trend Indicators:
- Moving averages (MA) show a slight downtrend, with the 5-day MA below the 10-day simple moving average (SMA).
- Exponential moving average (EMA) is also trending downwards, indicating a bearish sentiment.
- MACD line is below the signal line, suggesting a bearish momentum.
- Overall, the trend indicators point towards a downward movement in the stock price.
Momentum Indicators:
- Relative Strength Index (RSI) is below 50, indicating a bearish momentum.
- Stochastic oscillators show a mixed signal, with %K above %D but both in overbought territory.
- Williams %R is also in the oversold region, suggesting a potential reversal.
- Momentum indicators suggest a bearish sentiment in the short term.
Volatility Indicators:
- Bollinger Bands are narrowing, indicating reduced volatility.
- The lower and upper Bollinger Bands are converging, suggesting a potential breakout.
- Bollinger Band %B is near 0.5, indicating a balanced market sentiment.
- Volatility indicators signal a sideways movement or a potential breakout in the near future.
Volume Indicators:
- On-Balance Volume (OBV) has been fluctuating, showing no clear trend.
- Chaikin Money Flow (CMF) is negative, indicating selling pressure.
- Volume indicators do not provide a clear direction for the stock price.
Conclusion:
Based on the analysis of trend, momentum, volatility, and volume indicators, the overall outlook for FMST stock is bearish in the short term. The trend indicators suggest a downward movement, supported by bearish momentum signals. Volatility indicators point towards a potential breakout, while volume indicators do not provide a strong indication.
Key Conclusion: The next few days are likely to see a downward movement in FMST stock price, with a possibility of a breakout due to narrowing Bollinger Bands. Traders should exercise caution and consider implementing risk management strategies in their trading decisions.