Technical Analysis of FITB 2024-05-10
Overview:
In analyzing the technical indicators for FITB over the last 5 days, we will delve into the trend, momentum, volatility, and volume indicators to provide a comprehensive outlook on the possible stock price movement in the coming days.
Trend Indicators:
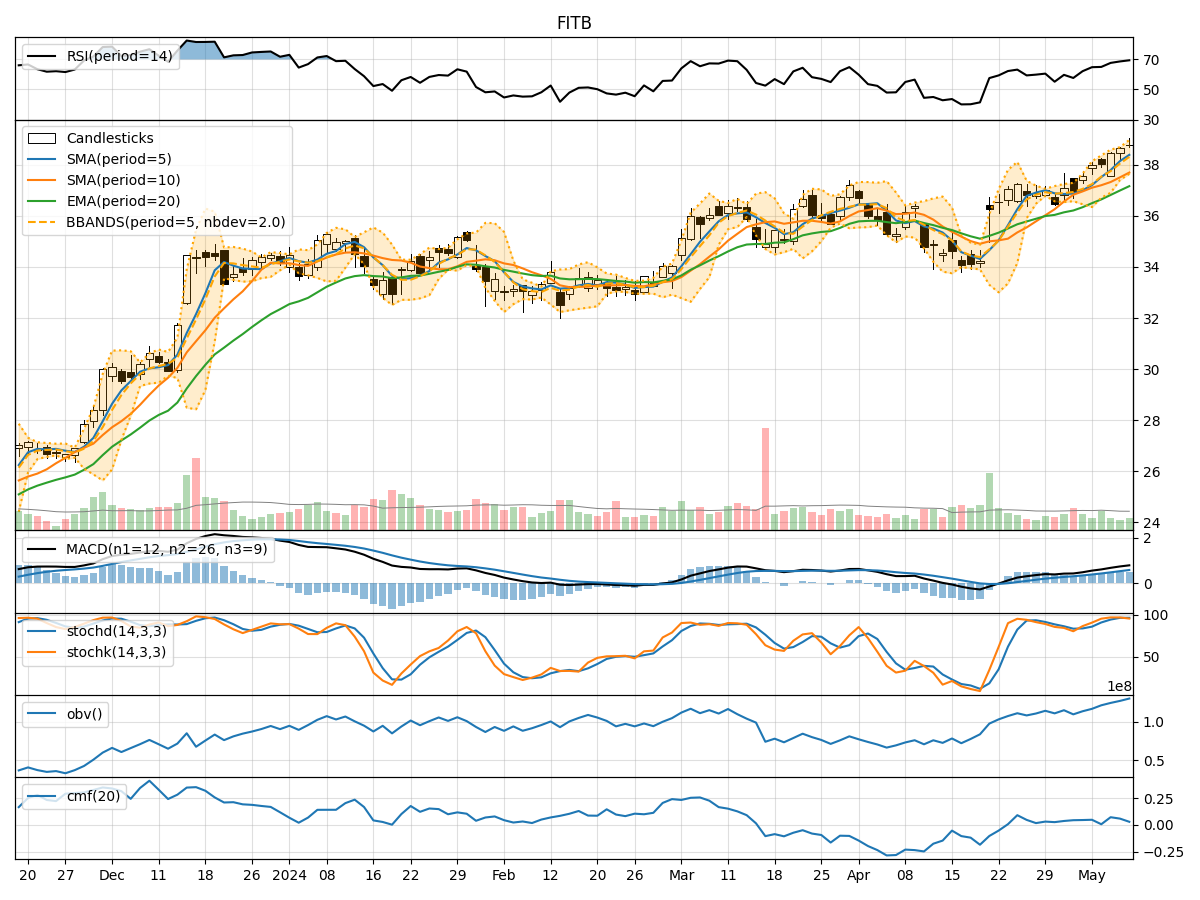
- Moving Averages (MA): The 5-day MA has been consistently above the 10-day SMA, indicating a short-term bullish trend. The EMA(20) has been steadily increasing, reflecting positive momentum.
- MACD: The MACD line has been above the signal line, suggesting a bullish trend. The MACD histogram has been mostly positive, indicating upward momentum.
Momentum Indicators:
- RSI: The RSI has been in the overbought territory, indicating a strong bullish momentum.
- Stochastic Oscillator: Both %K and %D have been in the overbought zone, signaling a potential reversal or consolidation.
- Williams %R: The indicator has been in the oversold region, suggesting a possible reversal to the upside.
Volatility Indicators:
- Bollinger Bands: The stock price has been trading near the upper Bollinger Band, indicating high volatility and a potential overbought condition.
- Bollinger %B: The %B indicator has been above 0.8, suggesting a potential overbought situation.
Volume Indicators:
- On-Balance Volume (OBV): The OBV has been increasing, indicating accumulation by investors.
- Chaikin Money Flow (CMF): The CMF has been positive, reflecting buying pressure in the stock.
Key Observations and Opinions:
- Trend: The stock is in a strong bullish trend based on moving averages and MACD.
- Momentum: While RSI and Stochastic Oscillator indicate overbought conditions, Williams %R suggests a potential reversal.
- Volatility: High volatility near the upper Bollinger Band may lead to a pullback or consolidation.
- Volume: Increasing OBV and positive CMF indicate buying interest in the stock.
Conclusion:
Based on the technical indicators and observations: - The stock is currently in an upward trend with strong momentum, but overbought conditions suggest a possible correction or consolidation in the short term. - Traders should exercise caution and consider taking profits or implementing risk management strategies to navigate potential price reversals. - Long-term investors may consider waiting for a pullback to enter at more favorable levels.
Overall Assessment:
- The stock is likely to experience a short-term correction or consolidation before potentially resuming its upward trajectory.
- It is crucial to monitor key support and resistance levels, as well as watch for any signs of trend reversal in the coming days.
- Maintaining a balanced approach between short-term trading and long-term investment strategies is advisable in the current market environment.