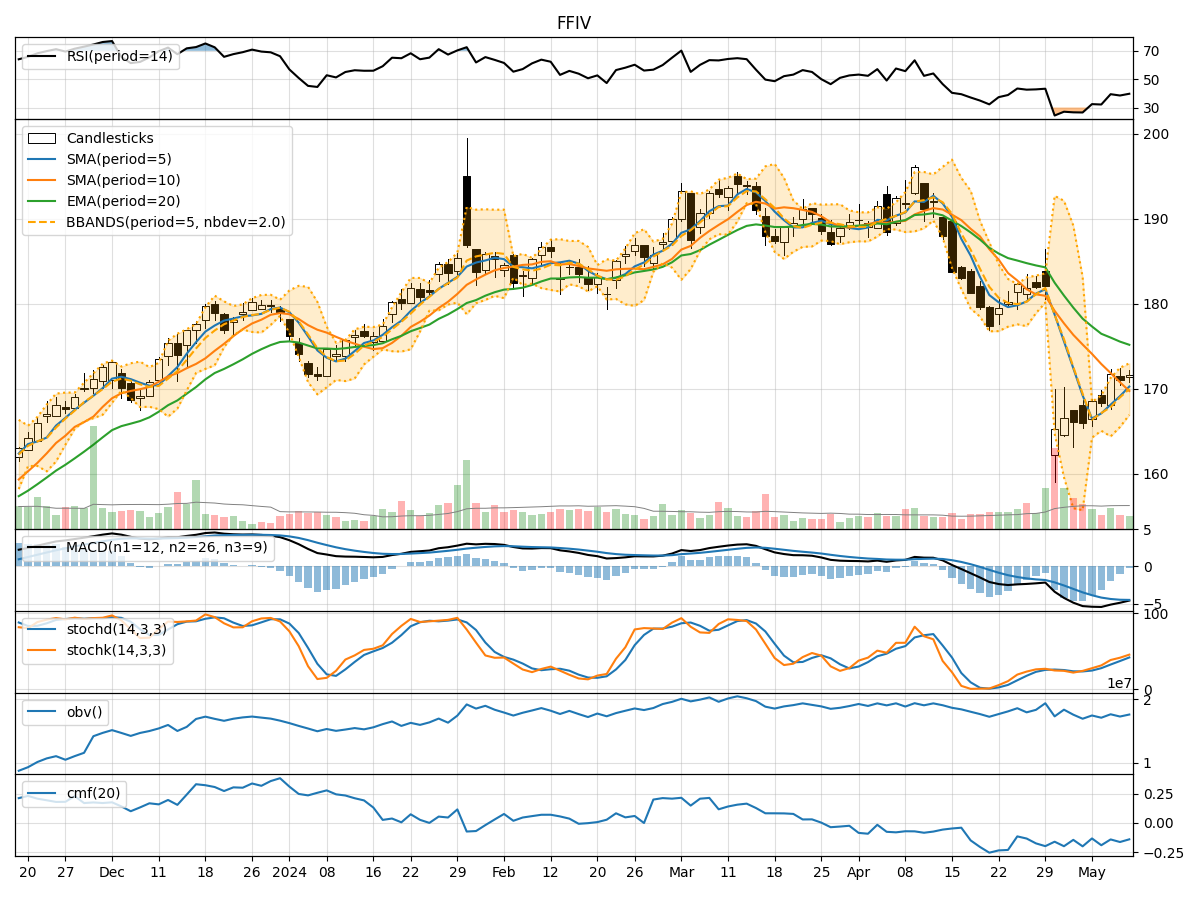
Technical Analysis of FFIV 2024-05-10
Overview:
In analyzing the technical indicators for FFIV over the last 5 days, we will delve into the trend, momentum, volatility, and volume indicators to provide a comprehensive outlook on the possible stock price movement. By examining these key aspects, we aim to offer valuable insights and predictions for the upcoming days.
Trend Analysis:
- Moving Averages (MA): The 5-day Moving Average (MA) has been fluctuating around the closing prices, indicating short-term price trends. The Simple Moving Average (SMA) and Exponential Moving Average (EMA) show a downward trend, with the EMA lagging behind.
- MACD: The Moving Average Convergence Divergence (MACD) is negative, suggesting a bearish momentum in the stock price.
- Conclusion: The trend indicators point towards a bearish outlook for FFIV in the short term.
Momentum Analysis:
- RSI: The Relative Strength Index (RSI) is below 50, indicating a bearish momentum in the stock.
- Stochastic Oscillator: Both %K and %D are in the oversold region, suggesting a potential reversal in the stock price.
- Williams %R: The Williams %R is also in the oversold territory, signaling a possible buying opportunity.
- Conclusion: The momentum indicators suggest a potential reversal in the bearish trend for FFIV.
Volatility Analysis:
- Bollinger Bands: The Bollinger Bands are narrowing, indicating decreasing volatility in the stock price.
- Conclusion: The volatility indicators suggest a consolidation phase for FFIV, with a potential breakout in either direction.
Volume Analysis:
- On-Balance Volume (OBV): The OBV has been fluctuating, indicating indecision among investors.
- Chaikin Money Flow (CMF): The CMF is negative, reflecting selling pressure in the stock.
- Conclusion: The volume indicators suggest a lack of strong buying interest in FFIV.
Overall Conclusion:
Based on the analysis of trend, momentum, volatility, and volume indicators, the following conclusions can be drawn: - The trend indicators point towards a bearish outlook in the short term. - The momentum indicators suggest a potential reversal in the bearish trend. - Volatility indicators indicate a consolidation phase with a potential breakout. - Volume indicators reflect a lack of strong buying interest in the stock.
Forecast:
Considering the mixed signals from the technical indicators, it is likely that FFIV will experience sideways movement in the next few days, with a potential for a bullish reversal if momentum indicators continue to improve. Traders should closely monitor key support and resistance levels for potential entry and exit points.
Disclaimer:
This analysis is based solely on technical indicators and historical data, and it is important to consider other fundamental factors and market dynamics before making any investment decisions. It is recommended to conduct thorough research and consult with a financial advisor for personalized guidance tailored to individual investment goals and risk tolerance levels.