Technical Analysis of EZGO 2024-05-10
Overview:
In analyzing the technical indicators for EZGO stock over the last 5 days, we will delve into the trend, momentum, volatility, and volume indicators to provide a comprehensive outlook on the possible stock price movement in the coming days. By examining these key indicators, we aim to offer valuable insights and predictions for potential investors.
Trend Analysis:
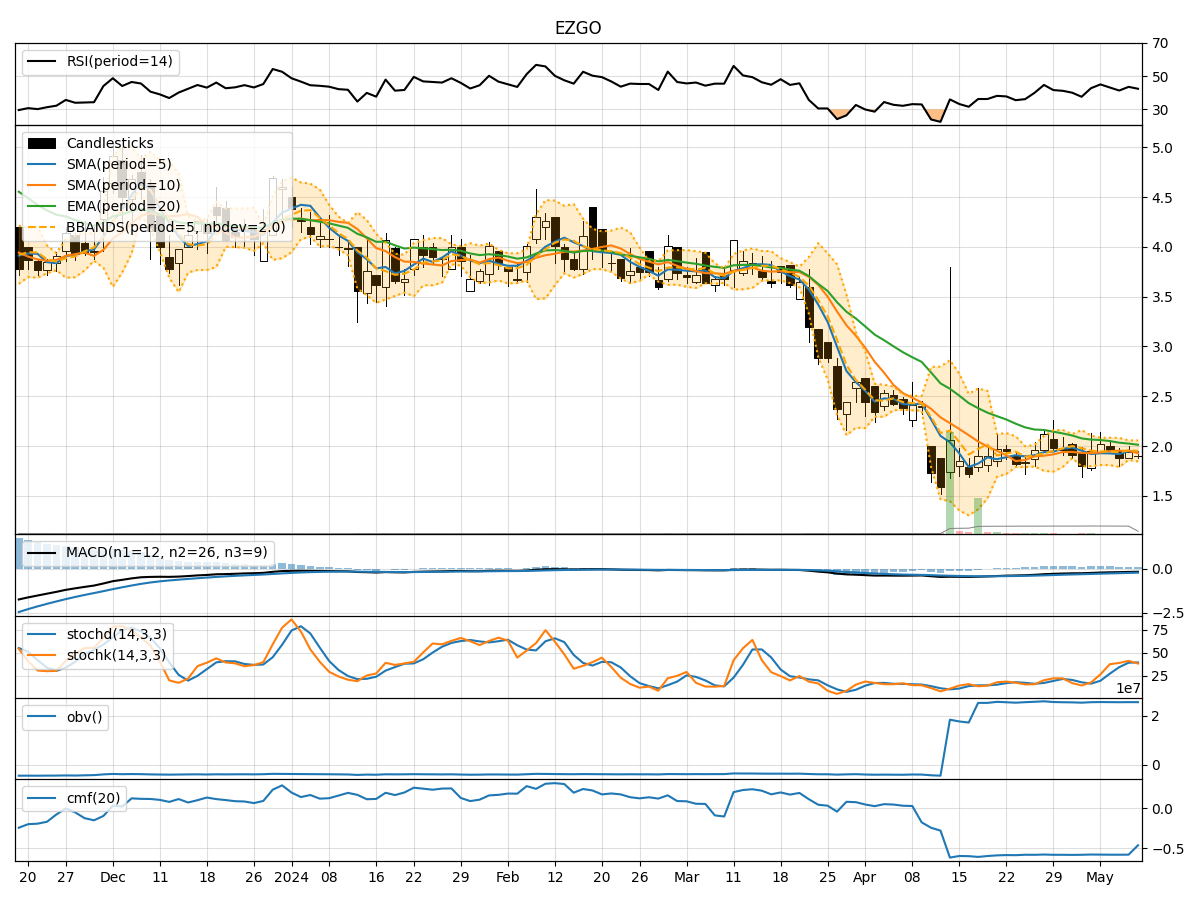
- Moving Averages (MA): The 5-day Moving Average (MA) has been fluctuating around the current stock price, indicating a lack of clear trend direction.
- MACD and Signal Line: The MACD has been consistently negative, suggesting a bearish momentum in the short term.
- Relative Strength Index (RSI): The RSI values have been hovering around the mid-range, indicating a neutral sentiment in terms of price momentum.
Momentum Analysis:
- Stochastic Oscillator: The Stochastic Oscillator values have been fluctuating within a narrow range, reflecting indecision in the market.
- Williams %R (Willr): The Williams %R values have been negative, indicating an oversold condition but not providing a clear signal for a reversal.
Volatility Analysis:
- Bollinger Bands (BB): The Bollinger Bands have been narrowing, suggesting decreasing volatility in the stock price.
- Bollinger Band %B (bbp): The %B values have been relatively low, indicating a potential consolidation phase.
Volume Analysis:
- On-Balance Volume (OBV): The OBV values have been fluctuating, showing no clear accumulation or distribution pattern.
- Chaikin Money Flow (CMF): The CMF values have been consistently negative, indicating selling pressure in the market.
Key Observations and Opinions:
- Trend: The trend indicators suggest a lack of clear direction, with a bearish bias indicated by the MACD.
- Momentum: The momentum indicators show indecision and a neutral stance, with no strong signals for a reversal.
- Volatility: Volatility is decreasing, potentially leading to a period of consolidation.
- Volume: The volume indicators reflect mixed signals, with no significant accumulation or distribution pattern.
Conclusion:
Based on the analysis of the technical indicators, the stock price of EZGO is likely to continue in a sideways consolidation pattern in the next few days. The lack of clear trend direction, coupled with neutral momentum and decreasing volatility, indicates a period of indecision and potential stabilization in the stock price. Investors should exercise caution and wait for clearer signals before making significant trading decisions.