Technical Analysis of EYPT 2024-05-10
Overview:
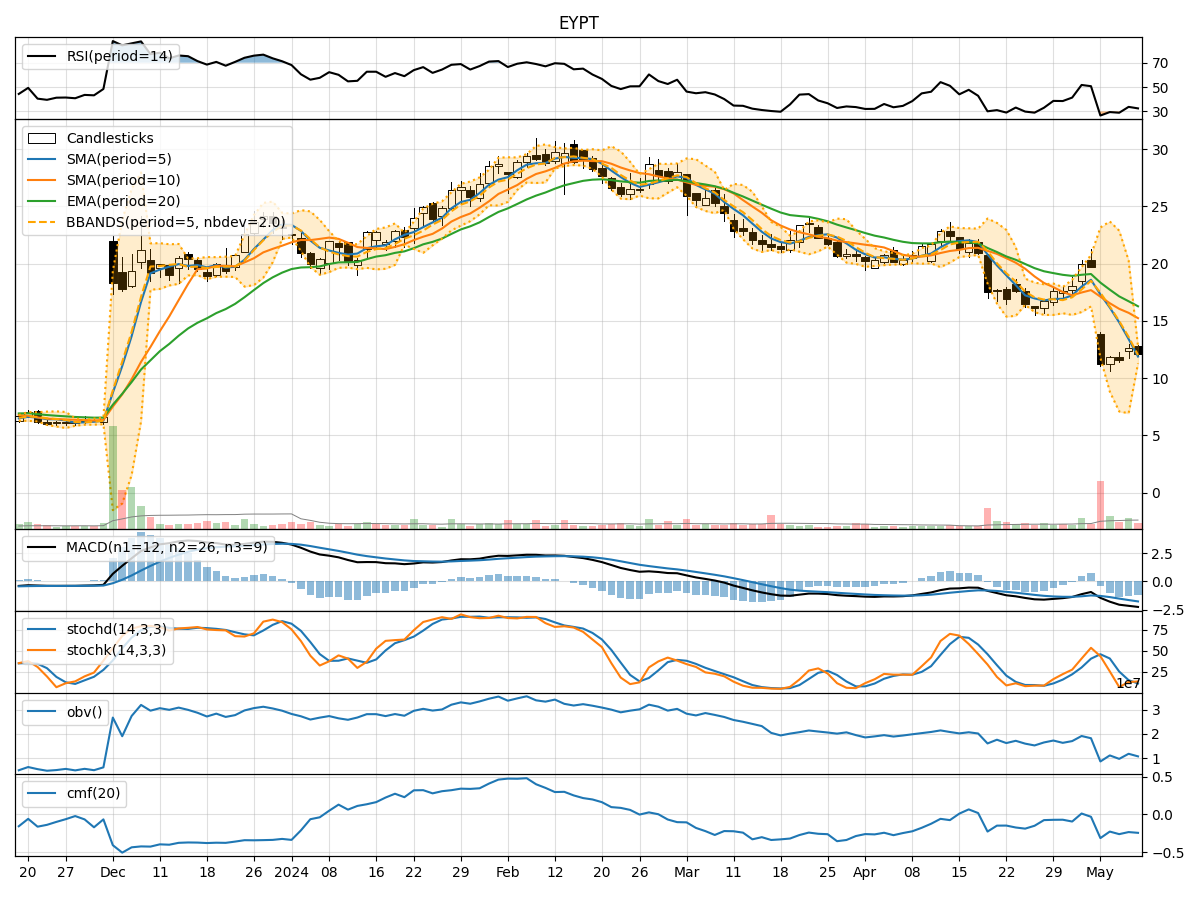
In analyzing the technical indicators for EYPT over the last 5 days, we will delve into the trend, momentum, volatility, and volume indicators to provide a comprehensive outlook on the possible stock price movement. By examining these key factors, we aim to offer valuable insights and predictions for the upcoming days.
Trend Analysis:
- Moving Averages (MA): The 5-day MA has been consistently decreasing, indicating a downward trend in the stock price.
- MACD: The MACD line has been consistently below the signal line, suggesting bearish momentum.
Key Observation: The trend indicators point towards a downward trajectory for the stock price.
Momentum Analysis:
- RSI: The RSI has been relatively low, indicating a potential oversold condition.
- Stochastic Oscillator: Both %K and %D have been trending lower, signaling weakening momentum.
Key Observation: Momentum indicators suggest a bearish sentiment in the market.
Volatility Analysis:
- Bollinger Bands (BB): The stock price has been trading below the lower Bollinger Band, indicating oversold conditions.
Key Observation: Volatility indicators suggest a potential reversal in the stock price.
Volume Analysis:
- On-Balance Volume (OBV): The OBV has been decreasing, indicating selling pressure in the market.
- Chaikin Money Flow (CMF): The CMF has been negative, reflecting a lack of buying interest.
Key Observation: Volume indicators point towards bearish market sentiment.
Conclusion:
Based on the analysis of trend, momentum, volatility, and volume indicators, the overall outlook for EYPT in the next few days is bearish. The stock is likely to continue its downward trend, supported by weakening momentum, oversold conditions, and negative volume signals. Traders and investors should exercise caution and consider short-term selling opportunities or wait for a potential reversal confirmation before considering long positions.
Key Takeaways:
- The stock is currently in a downtrend with bearish momentum.
- Volatility signals a potential reversal in the near future.
- Volume indicators reflect selling pressure in the market.
In conclusion, a cautious approach is recommended for trading EYPT in the upcoming days, with a focus on monitoring key support levels and waiting for confirmation of a trend reversal before considering long positions.