Technical Analysis of EVO 2024-05-10
Overview:
In analyzing the technical indicators for EVO stock over the last 5 days, we will delve into the trend, momentum, volatility, and volume indicators to provide a comprehensive outlook on the possible stock price movement in the coming days. By examining these key indicators, we aim to offer valuable insights and predictions for potential investors.
Trend Indicators:
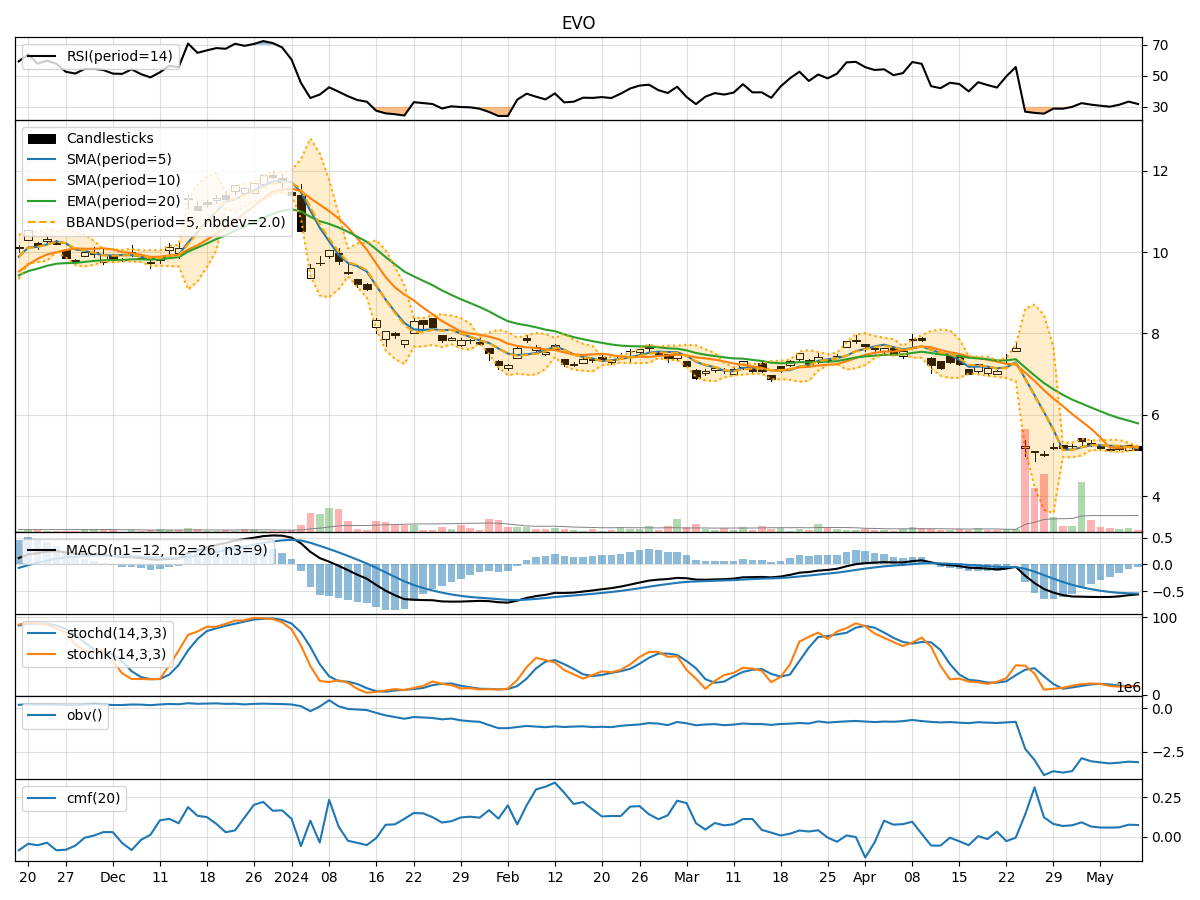
- Moving Averages (MA): The 5-day MA has been consistently below the closing prices, indicating a short-term downtrend.
- MACD: The MACD line has been below the signal line, suggesting a bearish momentum in the stock.
- EMA: The EMA has been declining, further supporting the bearish trend in the stock.
Momentum Indicators:
- RSI: The RSI has been hovering around 30, indicating oversold conditions in the stock.
- Stochastic Oscillator: Both %K and %D have been in the oversold territory, signaling a potential reversal in the stock's price.
- Williams %R: The Williams %R is also in the oversold region, supporting the possibility of a price reversal.
Volatility Indicators:
- Bollinger Bands (BB): The stock price has been trading near the lower Bollinger Band, suggesting a potential oversold condition.
- Bollinger Band Width: The BB width has been narrowing, indicating decreasing volatility in the stock.
- Bollinger Band %B: The %B is below 0.2, signaling a potential buying opportunity as the stock may be oversold.
Volume Indicators:
- On-Balance Volume (OBV): The OBV has been declining, indicating selling pressure in the stock.
- Chaikin Money Flow (CMF): The CMF has been positive but relatively flat, suggesting a neutral money flow in the stock.
Key Observations:
- The stock is currently in a downtrend based on moving averages and MACD.
- Momentum indicators suggest oversold conditions, potentially signaling a reversal in the stock price.
- Volatility indicators point towards decreasing volatility and a possible buying opportunity.
- Volume indicators show selling pressure but with a relatively neutral money flow.
Conclusion:
Based on the analysis of the technical indicators, the stock is likely to experience a short-term rebound in the coming days. The oversold conditions indicated by momentum indicators, coupled with the narrowing Bollinger Bands and the potential buying opportunity suggested by %B, point towards a possible upward movement in the stock price. However, investors should closely monitor the price action and volume trends for confirmation of a trend reversal.