Technical Analysis of EVAX 2024-05-10
Overview:
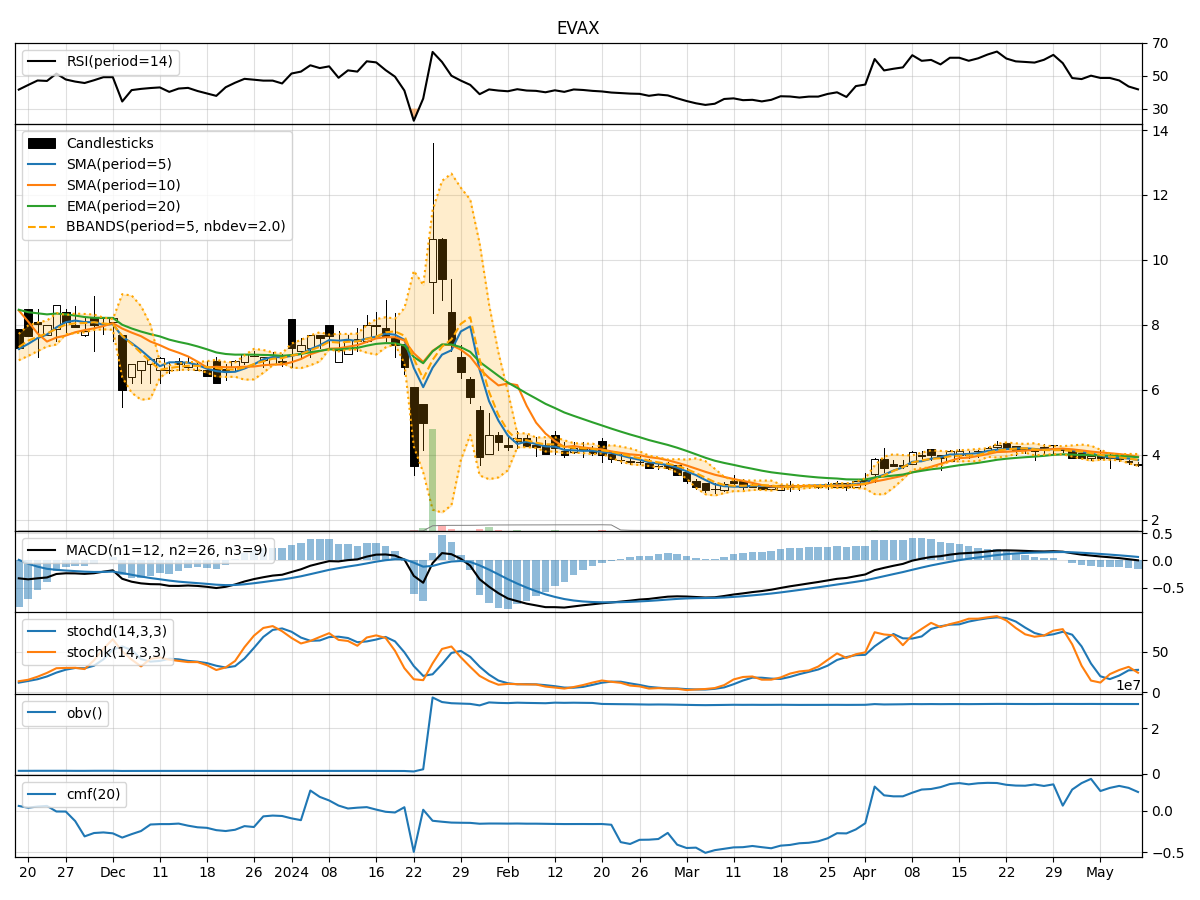
In analyzing the technical indicators for EVAX over the last 5 days, we will delve into the trend, momentum, volatility, and volume indicators to provide a comprehensive outlook on the possible stock price movement. By examining these key aspects, we aim to offer valuable insights and predictions for the upcoming days.
Trend Analysis:
- Moving Averages (MA): The 5-day MA has been consistently below the closing price, indicating a short-term downtrend.
- MACD: The MACD line has been positive but decreasing, while the MACD Histogram has been consistently negative, suggesting a weakening bullish momentum.
Momentum Analysis:
- RSI: The RSI has been declining, indicating a loss in bullish strength.
- Stochastic Oscillator: Both %K and %D have been decreasing, signaling a potential bearish crossover.
Volatility Analysis:
- Bollinger Bands (BB): The stock price has been trading within the lower Bollinger Band, indicating a potential oversold condition.
Volume Analysis:
- On-Balance Volume (OBV): The OBV has been declining, suggesting a decrease in buying pressure.
- Chaikin Money Flow (CMF): The CMF has been positive but trending downwards, indicating weakening buying pressure.
Key Observations:
- The stock is currently in a short-term downtrend based on moving averages.
- Momentum indicators show a weakening bullish momentum.
- Volatility is relatively low, with the stock trading near the lower Bollinger Band.
- Volume indicators suggest a decrease in buying pressure.
Conclusion:
Based on the analysis of the technical indicators, the outlook for EVAX in the next few days is bearish. The stock is likely to experience further downside movement, potentially testing lower support levels. Traders and investors should exercise caution and consider short-term selling strategies or wait for a more favorable entry point. It is advisable to closely monitor key support levels and any potential reversal signals before considering long positions.