Technical Analysis of ESTA 2024-05-10
Overview:
In analyzing the technical indicators for ESTA stock over the last 5 days, we will delve into the trend, momentum, volatility, and volume indicators to provide a comprehensive outlook on the possible stock price movement in the coming days. By examining these key factors, we aim to offer valuable insights and predictions to guide your investment decisions.
Trend Indicators:
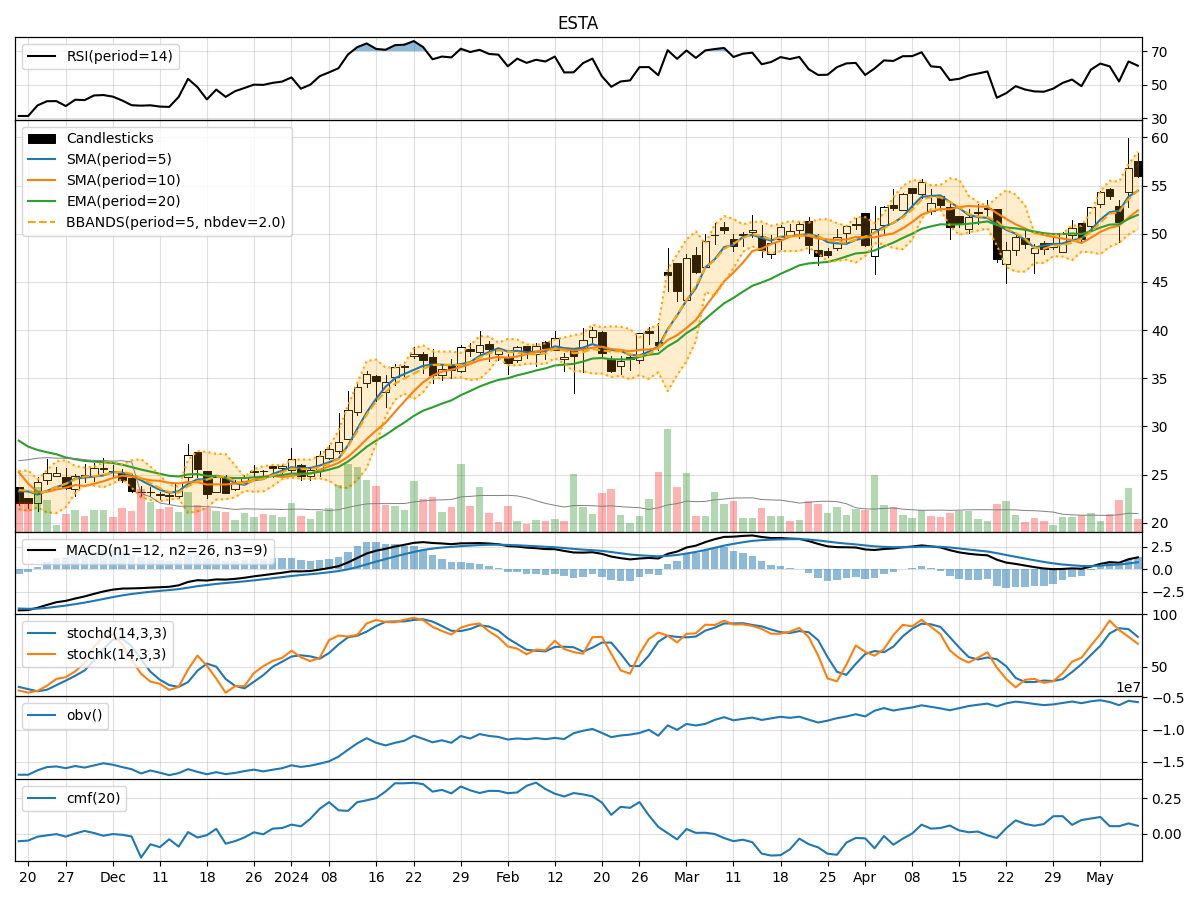
- Moving Averages (MA): The 5-day Moving Average (MA) has been consistently above the Simple Moving Average (SMA) and Exponential Moving Average (EMA), indicating a bullish trend.
- MACD: The MACD line has been above the signal line, with both lines showing an upward trend, suggesting positive momentum.
- RSI: The Relative Strength Index (RSI) has been fluctuating but generally staying within the neutral to slightly overbought territory.
Momentum Indicators:
- Stochastic Oscillator: The Stochastic Oscillator has been fluctuating but recently showing signs of a potential reversal from overbought levels.
- Williams %R: The Williams %R indicator has been in the oversold territory, indicating a possible reversal in the short term.
Volatility Indicators:
- Bollinger Bands: The Bollinger Bands have been widening, indicating increased volatility in the stock price.
- Volatility Percentage (BBP): The Bollinger Bands Percentage (BBP) has been fluctuating but generally staying within the normal range.
Volume Indicators:
- On-Balance Volume (OBV): The OBV has been fluctuating, suggesting mixed buying and selling pressure.
- Chaikin Money Flow (CMF): The CMF has been positive but relatively low, indicating some accumulation in the stock.
Key Observations and Opinions:
- Trend: The stock is currently in an upward trend based on moving averages and MACD.
- Momentum: Momentum indicators suggest a potential short-term reversal from overbought levels.
- Volatility: Volatility has increased, indicating potential price swings.
- Volume: Mixed signals from volume indicators suggest uncertainty in market sentiment.
Conclusion:
Based on the analysis of technical indicators, the next few days' possible stock price movement for ESTA stock is likely to experience increased volatility with a potential short-term reversal in momentum. Traders should closely monitor key levels such as support and resistance to capitalize on potential price swings. Exercise caution in trading decisions and consider implementing risk management strategies to navigate the market uncertainties effectively.