Technical Analysis of ESGR 2024-05-10
Overview:
In analyzing the technical indicators for ESGR over the last 5 days, we will delve into the trend, momentum, volatility, and volume indicators to provide a comprehensive outlook on the possible stock price movement in the coming days. By examining these key aspects, we aim to offer valuable insights and predictions to guide investment decisions.
Trend Indicators:
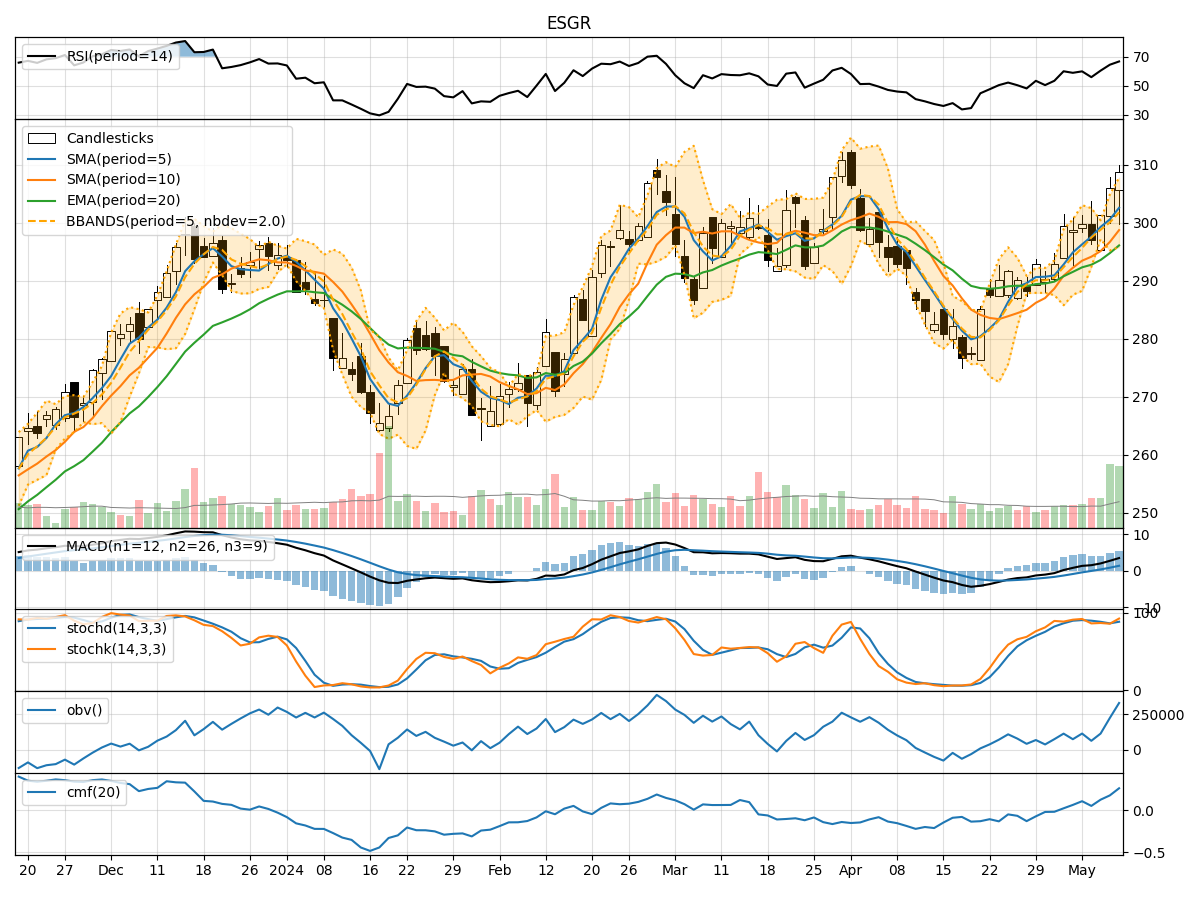
- Moving Averages (MA): The 5-day moving average has been consistently trending above the simple moving average (SMA) and exponential moving average (EMA), indicating a bullish trend.
- MACD: The MACD line has been consistently above the signal line, with increasing values, suggesting strong bullish momentum.
- Conclusion: The trend indicators point towards a strong bullish sentiment in the stock price movement.
Momentum Indicators:
- RSI: The Relative Strength Index (RSI) has been gradually increasing and is currently in the overbought territory, indicating a strong buying momentum.
- Stochastic Oscillator: Both %K and %D have been relatively high, suggesting a bullish momentum.
- Conclusion: Momentum indicators signal a strong bullish sentiment in the stock price movement.
Volatility Indicators:
- Bollinger Bands: The stock price has been consistently trading above the middle Bollinger Band (BBM), indicating an upward trend.
- Bollinger Band Width: The band width has been expanding, suggesting increased volatility in the stock price.
- Conclusion: Volatility indicators imply an upward trend with increased price fluctuations.
Volume Indicators:
- On-Balance Volume (OBV): The OBV has been steadily increasing over the last 5 days, indicating strong buying volume.
- Chaikin Money Flow (CMF): The CMF has been positive and rising, reflecting buying pressure in the stock.
- Conclusion: Volume indicators suggest strong buying interest and support the bullish trend.
Overall Conclusion:
Based on the analysis of trend, momentum, volatility, and volume indicators, the collective outlook for ESGR stock price movement in the next few days is strongly bullish. The consistent uptrend in moving averages, robust momentum signals, increasing volatility with an upward bias, and strong buying volume all point towards a continuation of the current bullish trend.
Recommendation:
Considering the overwhelmingly positive technical indicators, investors may consider buying or holding positions in ESGR stock for potential further upside. However, it is essential to monitor the indicators closely for any signs of reversal or overextension in the bullish momentum. As always, risk management strategies should be in place to protect against unexpected market movements.