Technical Analysis of ESGL 2024-05-10
Overview:
In analyzing the technical indicators for ESGL over the last 5 days, we will delve into the trend, momentum, volatility, and volume indicators to provide a comprehensive outlook on the possible stock price movement. By examining these key aspects, we aim to offer valuable insights and predictions for the upcoming trading days.
Trend Analysis:
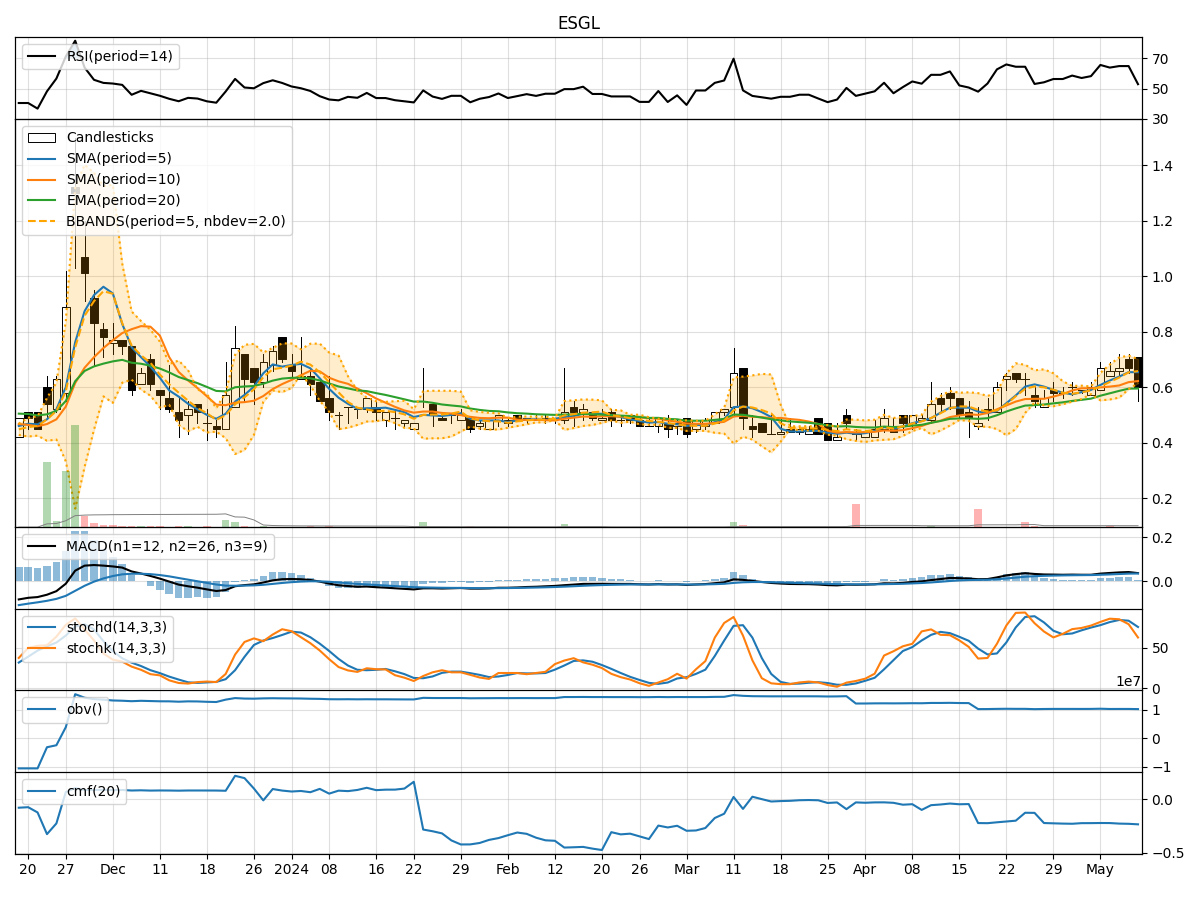
- Moving Averages (MA): The 5-day Moving Average (MA) has been showing an upward trend, indicating a positive momentum in the stock price.
- MACD: The Moving Average Convergence Divergence (MACD) has been consistently positive, suggesting a bullish trend in the stock.
- EMA: The Exponential Moving Average (EMA) has been steadily increasing, further supporting the bullish sentiment in the stock.
Momentum Analysis:
- RSI: The Relative Strength Index (RSI) has been fluctuating but generally staying within the neutral to overbought territory, indicating a mixed sentiment among traders.
- Stochastic Oscillator: Both %K and %D have been showing a downward trend, signaling a potential reversal in momentum.
- Williams %R: The Williams %R is in oversold territory, suggesting a possible buying opportunity.
Volatility Analysis:
- Bollinger Bands: The Bollinger Bands have been narrowing, indicating decreasing volatility in the stock price.
- Bollinger %B: The %B indicator is close to 0, suggesting that the stock price is near the lower band, potentially indicating an oversold condition.
Volume Analysis:
- On-Balance Volume (OBV): The OBV has been declining, indicating a decrease in buying pressure.
- Chaikin Money Flow (CMF): The CMF has been negative, suggesting that money is flowing out of the stock.
Key Observations:
- The trend indicators suggest a bullish sentiment in the stock, supported by positive MA, MACD, and EMA.
- Momentum indicators show a mixed sentiment, with RSI fluctuating, Stochastic Oscillator indicating a potential reversal, and Williams %R in oversold territory.
- Volatility is decreasing, as indicated by the narrowing Bollinger Bands and %B nearing the lower band.
- Volume indicators point towards a decrease in buying pressure, with OBV declining and CMF negative.
Conclusion:
Based on the analysis of the technical indicators, the stock price of ESGL is likely to experience a short-term consolidation or sideways movement in the upcoming trading days. While the trend indicators suggest a bullish sentiment, the mixed momentum signals and decreasing buying pressure indicate a potential period of consolidation. Traders should exercise caution and closely monitor key support and resistance levels for potential entry or exit points.