Technical Analysis of ESEA 2024-05-10
Overview:
In analyzing the technical indicators for ESEA over the last 5 days, we will delve into the trend, momentum, volatility, and volume indicators to provide a comprehensive outlook on the possible stock price movement in the coming days. By examining these key indicators, we aim to offer valuable insights and predictions for informed decision-making.
Trend Analysis:
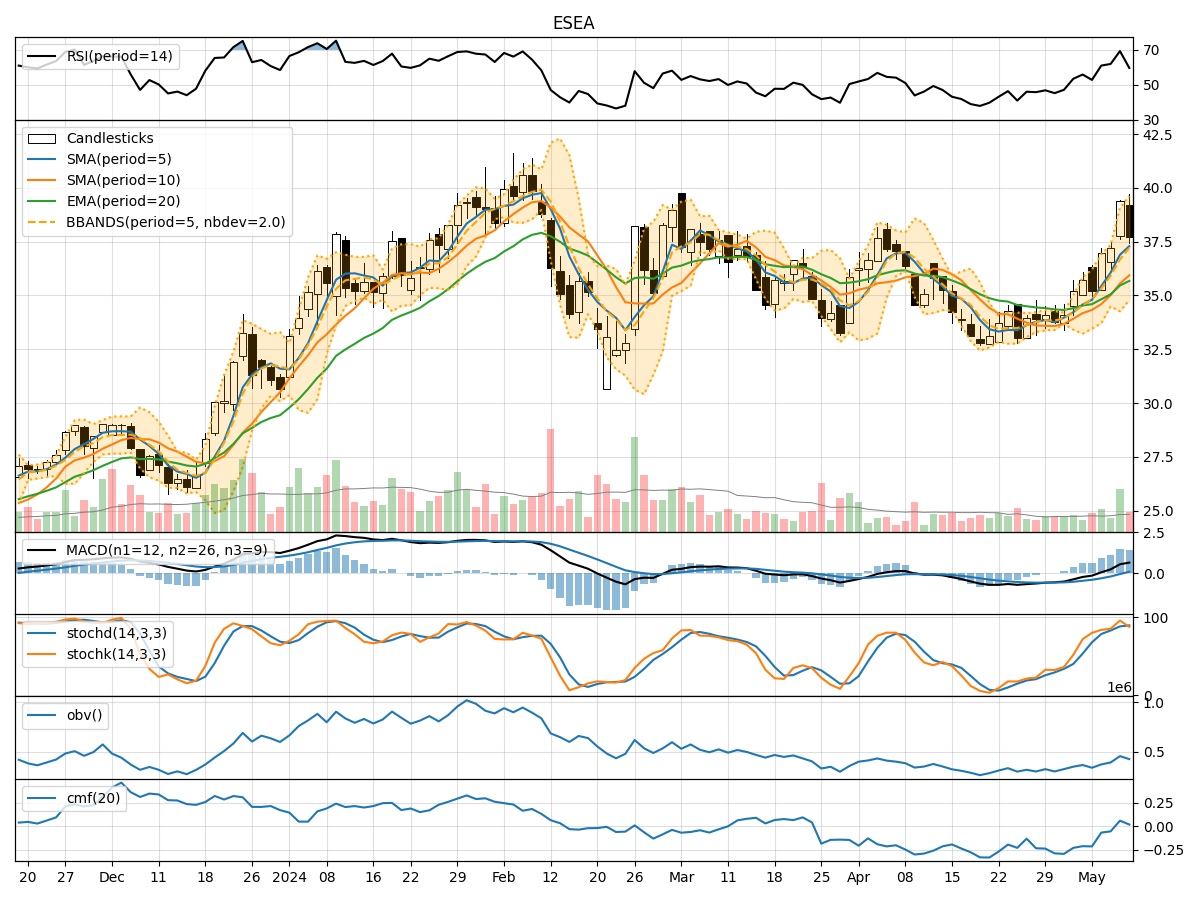
- Moving Averages (MA): The 5-day MA has been consistently trending above the closing prices, indicating a bullish trend.
- MACD: The MACD line has been above the signal line, suggesting a bullish momentum.
- RSI: The RSI has been fluctuating but generally staying within the neutral range, indicating a balanced market sentiment.
Momentum Analysis:
- Stochastic Oscillator: Both %K and %D have been in the overbought territory, signaling a potential reversal or consolidation.
- Williams %R: The indicator has been fluctuating in the oversold and overbought zones, suggesting mixed momentum.
Volatility Analysis:
- Bollinger Bands: The stock price has been mostly within the bands, indicating moderate volatility.
- BB%: The %B indicator has been fluctuating around the midline, reflecting a balanced volatility level.
Volume Analysis:
- On-Balance Volume (OBV): The OBV has been fluctuating, indicating indecision among investors.
- Chaikin Money Flow (CMF): The CMF has been negative, suggesting selling pressure in the market.
Key Observations:
- The trend indicators suggest a bullish sentiment in the short term.
- Momentum indicators show signs of potential reversal or consolidation.
- Volatility remains moderate, with no extreme price movements.
- Volume indicators reflect mixed investor sentiment and selling pressure.
Conclusion:
Based on the analysis of the technical indicators, the next few days' possible stock price movement for ESEA could be sideways with a slight bullish bias. While the trend indicators point towards a bullish outlook, the momentum indicators indicate a potential reversal or consolidation. Volatility is expected to remain moderate, and volume indicators suggest mixed investor sentiment. Therefore, investors should closely monitor key support and resistance levels for potential entry or exit points in the coming days.