Technical Analysis of ERIC 2024-05-10
Overview:
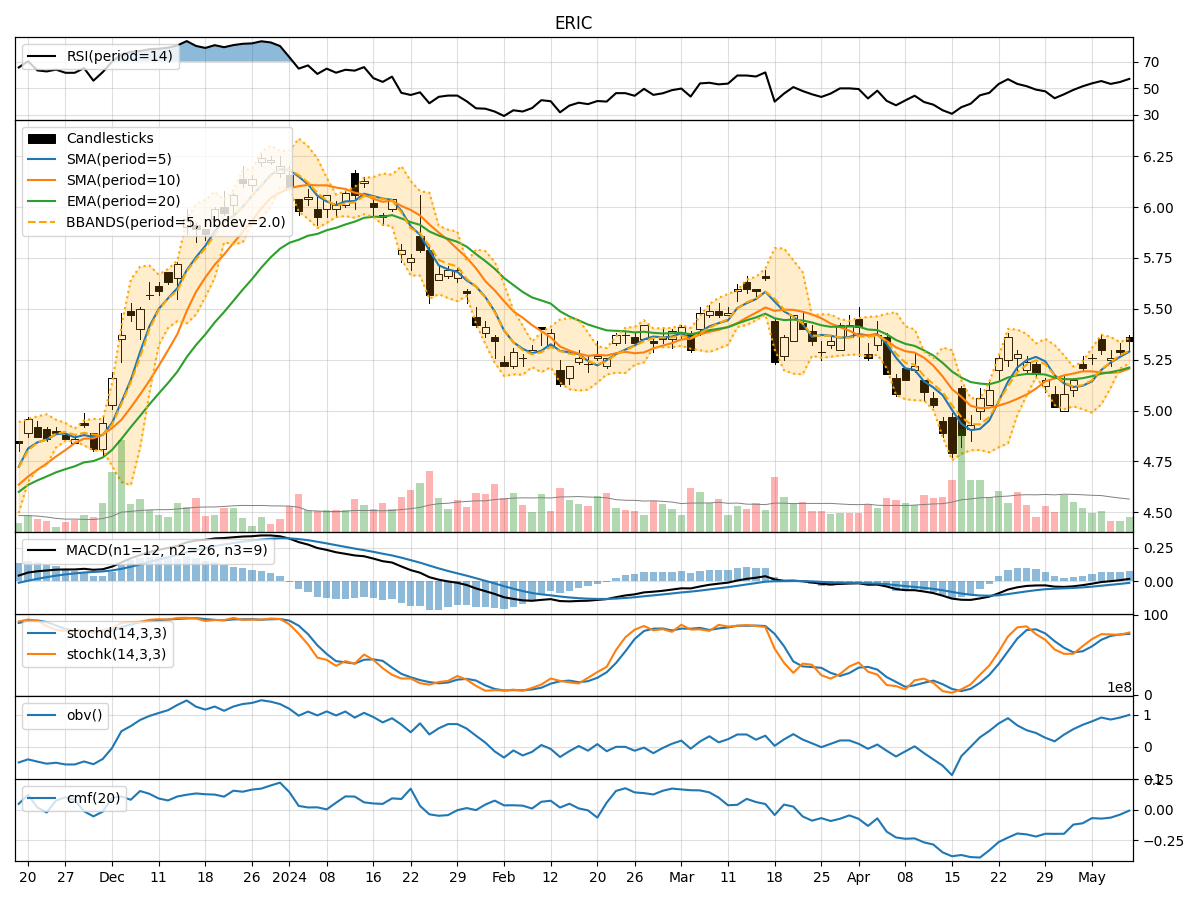
In analyzing the technical indicators for ERIC over the last 5 days, we will delve into the trend, momentum, volatility, and volume indicators to provide a comprehensive outlook on the possible stock price movement in the coming days. By examining these key indicators, we aim to offer valuable insights and predictions to guide your investment decisions.
Trend Analysis:
- Moving Averages (MA): The 5-day Moving Average (MA) has been consistently rising, indicating a positive trend in the stock price.
- MACD: The MACD line has been increasing, with the MACD line crossing above the signal line, suggesting a bullish momentum.
- RSI: The Relative Strength Index (RSI) is in the neutral zone, indicating neither overbought nor oversold conditions.
Momentum Analysis:
- Stochastic Oscillator: Both %K and %D lines of the Stochastic Oscillator are in the overbought territory, signaling a potential reversal or consolidation.
- Williams %R: The Williams %R is also in the overbought region, further supporting a possible pullback in the stock price.
Volatility Analysis:
- Bollinger Bands (BB): The stock price has been trading within the upper Bollinger Band, suggesting an overbought condition.
- Bollinger Band Width (BBW): The Bollinger Band Width has been narrowing, indicating decreasing volatility in the stock price.
Volume Analysis:
- On-Balance Volume (OBV): The OBV has been trending upwards, reflecting accumulation by investors.
- Chaikin Money Flow (CMF): The CMF is negative, indicating selling pressure in the stock.
Key Observations and Opinions:
- Trend: The stock is in an upward trend based on moving averages and MACD.
- Momentum: Momentum indicators suggest a potential reversal due to overbought conditions.
- Volatility: Volatility is decreasing, indicating a possible period of consolidation.
- Volume: The OBV shows accumulation, but the CMF signals selling pressure.
Conclusion:
Based on the analysis of technical indicators, the next few days may see the stock price of ERIC experiencing a pullback or consolidation after the recent bullish momentum. Traders should be cautious of the overbought conditions indicated by momentum indicators and the narrowing Bollinger Band Width. It is advisable to wait for a clearer signal or confirmation of a new trend direction before making significant trading decisions.