Technical Analysis of EQIX 2024-05-10
Overview:
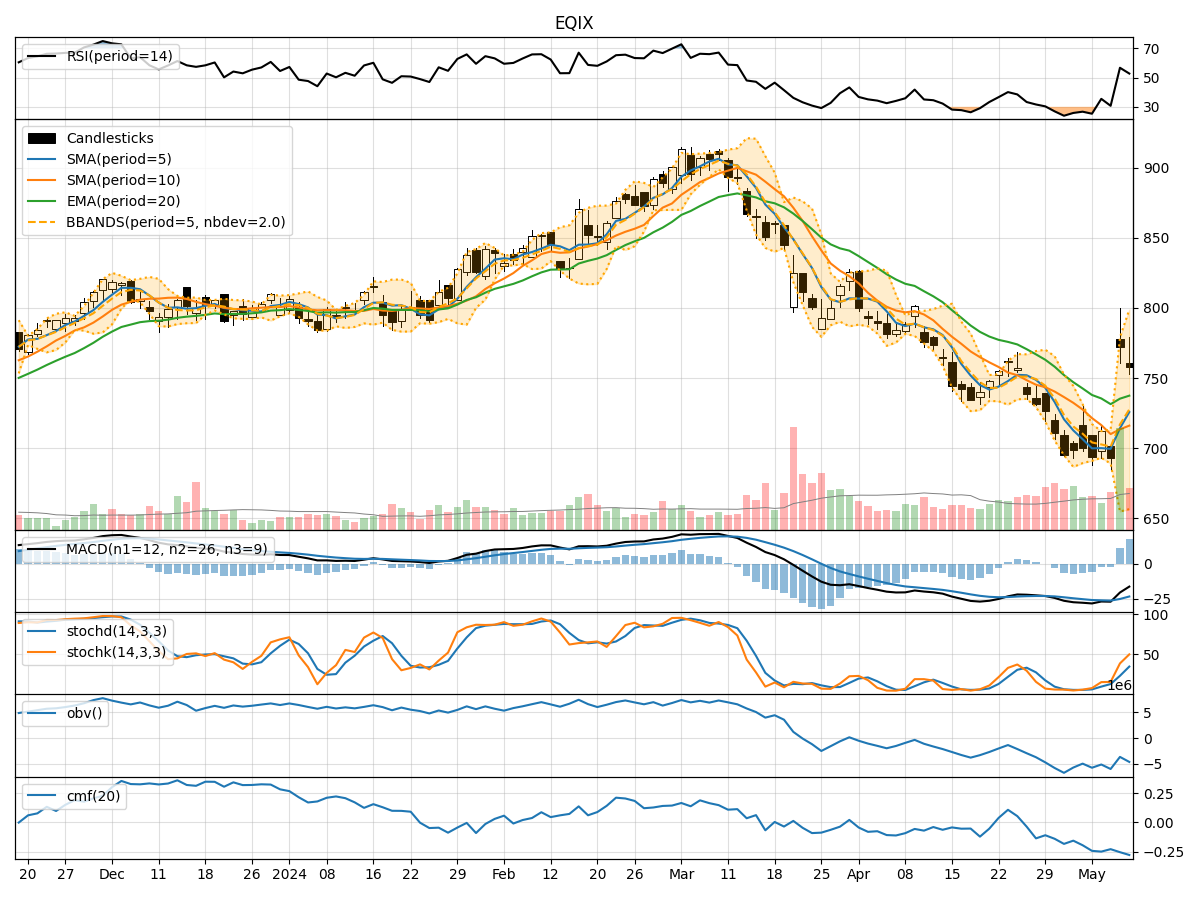
In analyzing the technical indicators for EQIX over the last 5 days, we will delve into the trend, momentum, volatility, and volume indicators to provide a comprehensive outlook on the possible stock price movement in the coming days.
Trend Analysis:
- Moving Averages (MA): The 5-day Moving Average (MA) has been fluctuating around the 700 level, indicating a short-term consolidation phase. Both the Simple Moving Average (SMA) and Exponential Moving Average (EMA) show a downward trend, suggesting a bearish sentiment.
- MACD: The Moving Average Convergence Divergence (MACD) has been negative, with the MACD line consistently below the signal line. This indicates a bearish momentum in the stock price.
- Conclusion: The trend indicators point towards a bearish outlook for EQIX in the short term.
Momentum Analysis:
- RSI: The Relative Strength Index (RSI) has been hovering around the mid-level, indicating a neutral momentum in the stock.
- Stochastic Oscillator: Both %K and %D of the Stochastic Oscillator have been in the oversold region, suggesting a potential reversal in the stock price.
- Conclusion: The momentum indicators suggest a neutral to slightly bullish sentiment for EQIX.
Volatility Analysis:
- Bollinger Bands: The Bollinger Bands have widened, indicating increased volatility in the stock price. The current price is near the lower band, suggesting a possible oversold condition.
- Conclusion: The volatility indicators signal a high volatility environment for EQIX.
Volume Analysis:
- On-Balance Volume (OBV): The OBV has been declining over the last 5 days, indicating a net selling pressure in the stock.
- Chaikin Money Flow (CMF): The CMF has been negative, reflecting a bearish money flow into the stock.
- Conclusion: The volume indicators point towards a bearish sentiment for EQIX.
Overall Conclusion:
Based on the analysis of trend, momentum, volatility, and volume indicators, the overall outlook for EQIX in the next few days is bearish. The trend indicators suggest a downward movement, supported by the negative MACD. While momentum indicators show a neutral to slightly bullish stance, the high volatility and bearish volume indicators outweigh this sentiment.
Recommendation:
Considering the comprehensive analysis of technical indicators, it is advisable to exercise caution when trading EQIX in the coming days. Traders may consider short-term bearish strategies or wait for a clearer signal before entering a position. Monitoring key support and resistance levels along with any potential reversal patterns will be crucial in navigating the market dynamics for EQIX.