Technical Analysis of EPOW 2024-05-10
Overview:
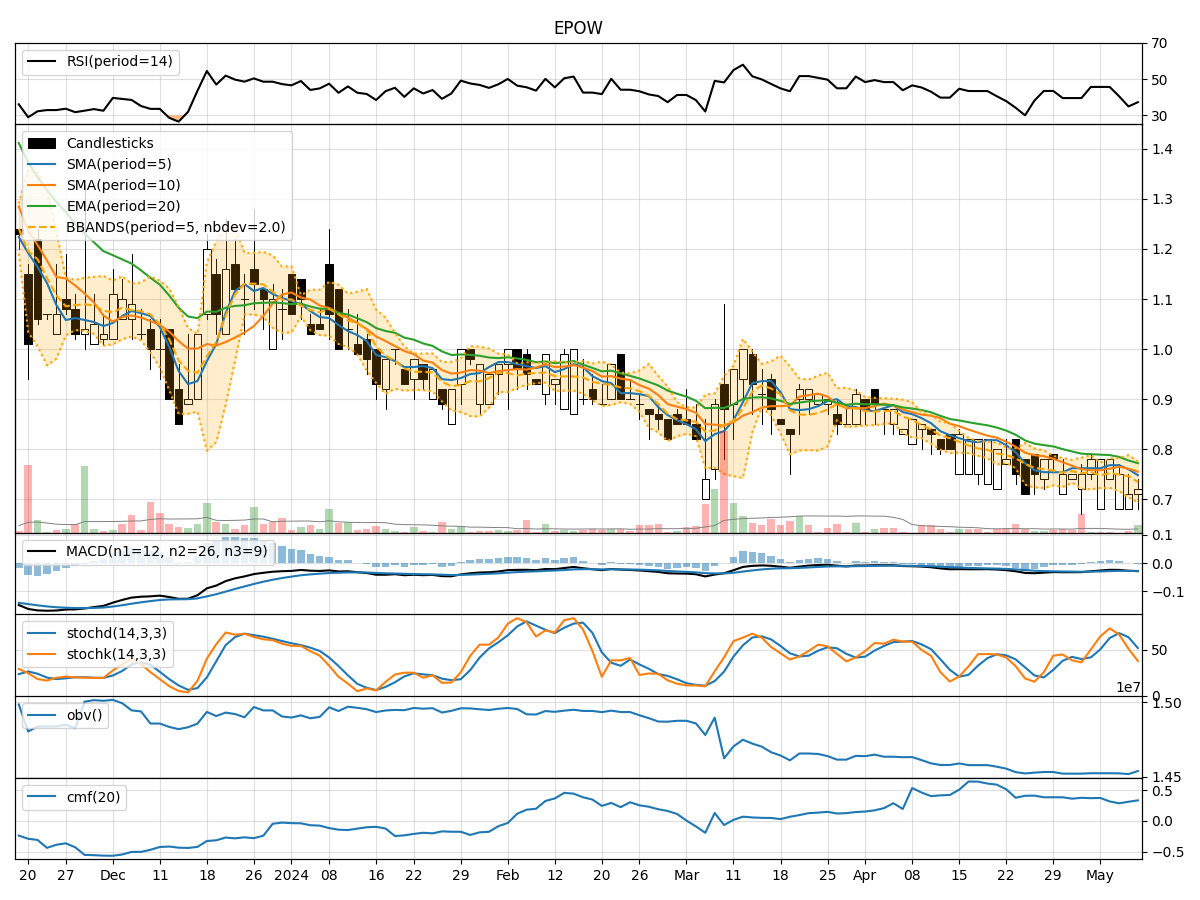
In analyzing the technical indicators for EPOW over the last 5 days, we will delve into the trend, momentum, volatility, and volume indicators to provide a comprehensive outlook on the possible stock price movement in the coming days. By examining these key aspects, we aim to offer valuable insights and recommendations for your investment decisions.
Trend Analysis:
- Moving Averages (MA): The 5-day MA has been declining, indicating a short-term bearish trend.
- MACD: The MACD line has been consistently below the signal line, suggesting a bearish momentum.
- EMA: The EMA has been decreasing, aligning with the bearish sentiment in the short term.
Momentum Analysis:
- RSI: The RSI has been trending downwards, reflecting weakening momentum.
- Stochastic Oscillator: Both %K and %D have been decreasing, indicating a bearish momentum.
- Williams %R: The indicator has been in oversold territory, signaling a potential reversal.
Volatility Analysis:
- Bollinger Bands (BB): The stock price has been trading below the lower Bollinger Band, indicating oversold conditions.
- Bollinger Band Width (BBW): The BBW has been expanding, suggesting increased volatility.
- Bollinger Band %B (BBP): The %B is below 0.2, indicating potential oversold conditions.
Volume Analysis:
- On-Balance Volume (OBV): The OBV has been declining, signaling selling pressure.
- Chaikin Money Flow (CMF): The CMF has been decreasing, indicating outflows from the stock.
Key Observations:
- The trend indicators, momentum oscillators, and volume indicators all point towards a bearish sentiment in the short term.
- Volatility has increased, suggesting potential price swings in the coming days.
- The stock is currently oversold based on various indicators, indicating a possible reversal.
Conclusion:
Based on the analysis of the technical indicators, the outlook for EPOW in the next few days is bearish. The stock is likely to experience further downside pressure, potentially leading to lower price levels. Traders should exercise caution and consider waiting for signs of a reversal before considering any long positions. It is advisable to closely monitor key support levels and wait for confirmation of a trend reversal before entering any trades.