Technical Analysis of EPIX 2024-05-10
Overview:
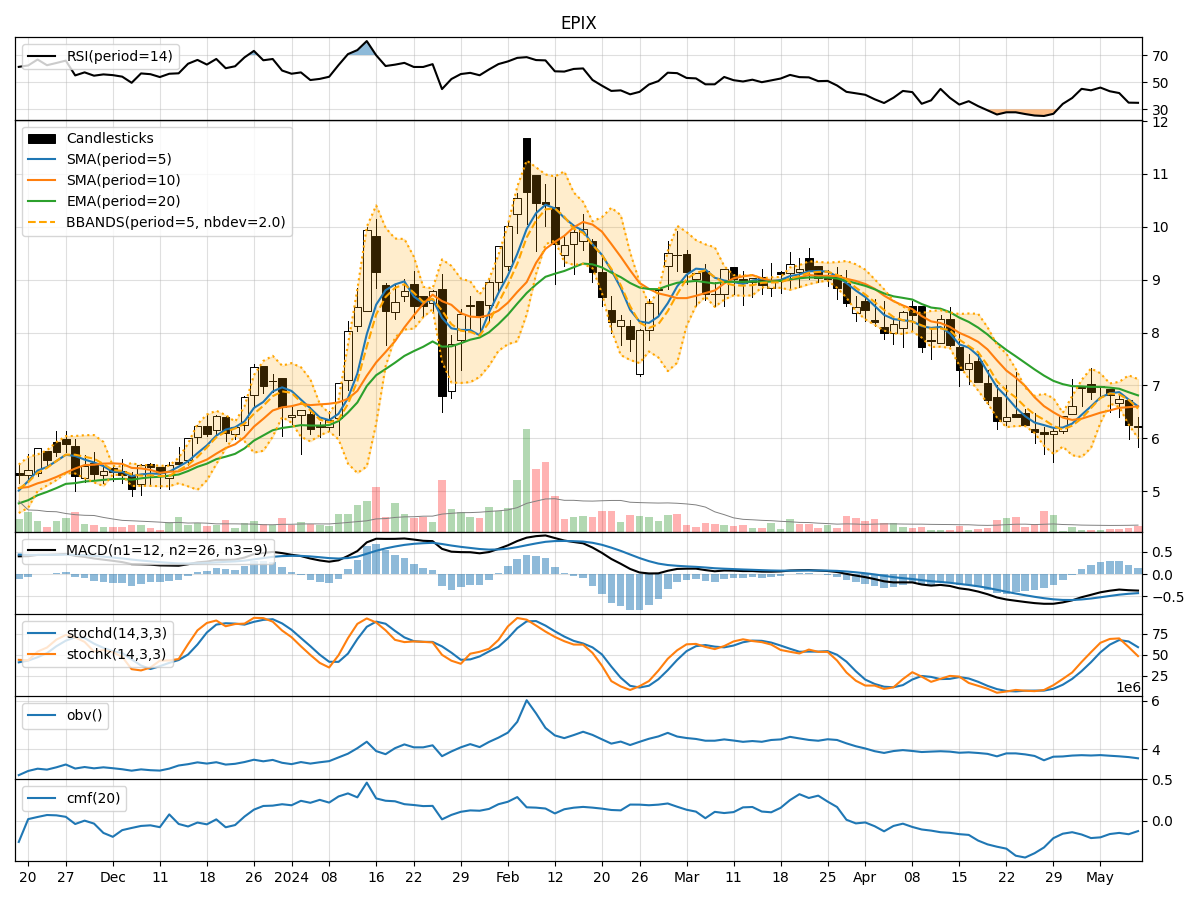
In analyzing the technical indicators for EPIX over the last 5 days, we will delve into the trend, momentum, volatility, and volume indicators to provide a comprehensive outlook on the possible stock price movement in the coming days.
Trend Analysis:
- Moving Averages (MA): The 5-day Moving Average (MA) has been declining steadily, indicating a bearish trend in the short term.
- MACD: The Moving Average Convergence Divergence (MACD) has been negative, suggesting a bearish momentum in the stock price.
- EMA: The Exponential Moving Average (EMA) has also been trending downwards, reinforcing the bearish sentiment in the stock.
Momentum Analysis:
- RSI: The Relative Strength Index (RSI) has been decreasing, indicating weakening momentum in the stock.
- Stochastic Oscillator: Both %K and %D of the Stochastic Oscillator have been declining, signaling a bearish momentum.
- Williams %R: The Williams %R is in the oversold territory, suggesting a potential reversal or continuation of the downtrend.
Volatility Analysis:
- Bollinger Bands (BB): The Bollinger Bands have been widening, indicating increased volatility in the stock price.
- BB% (Bollinger Band %B): The BB% has been fluctuating, reflecting the volatility in the stock.
- Average True Range (ATR): ATR can provide insights into the volatility levels, which seem to be elevated based on the widening Bollinger Bands.
Volume Analysis:
- On-Balance Volume (OBV): The OBV has been consistently decreasing, indicating selling pressure in the stock.
- Chaikin Money Flow (CMF): The CMF has been negative, suggesting outflow of money from the stock.
Key Observations:
- The stock is currently in a downtrend based on the moving averages and MACD.
- Momentum indicators like RSI and Stochastic Oscillator are showing bearish signals.
- Volatility has increased, as seen in the widening Bollinger Bands.
- Volume indicators reflect selling pressure with declining OBV and negative CMF.
Conclusion:
Based on the analysis of the technical indicators, the next few days for EPIX are likely to see a continuation of the bearish trend. The stock may experience further downside movement, with increased volatility and selling pressure. Traders and investors should exercise caution and consider shorting or staying away from long positions until there are clear signs of a trend reversal.