Technical Analysis of ENTX 2024-05-10
Overview:
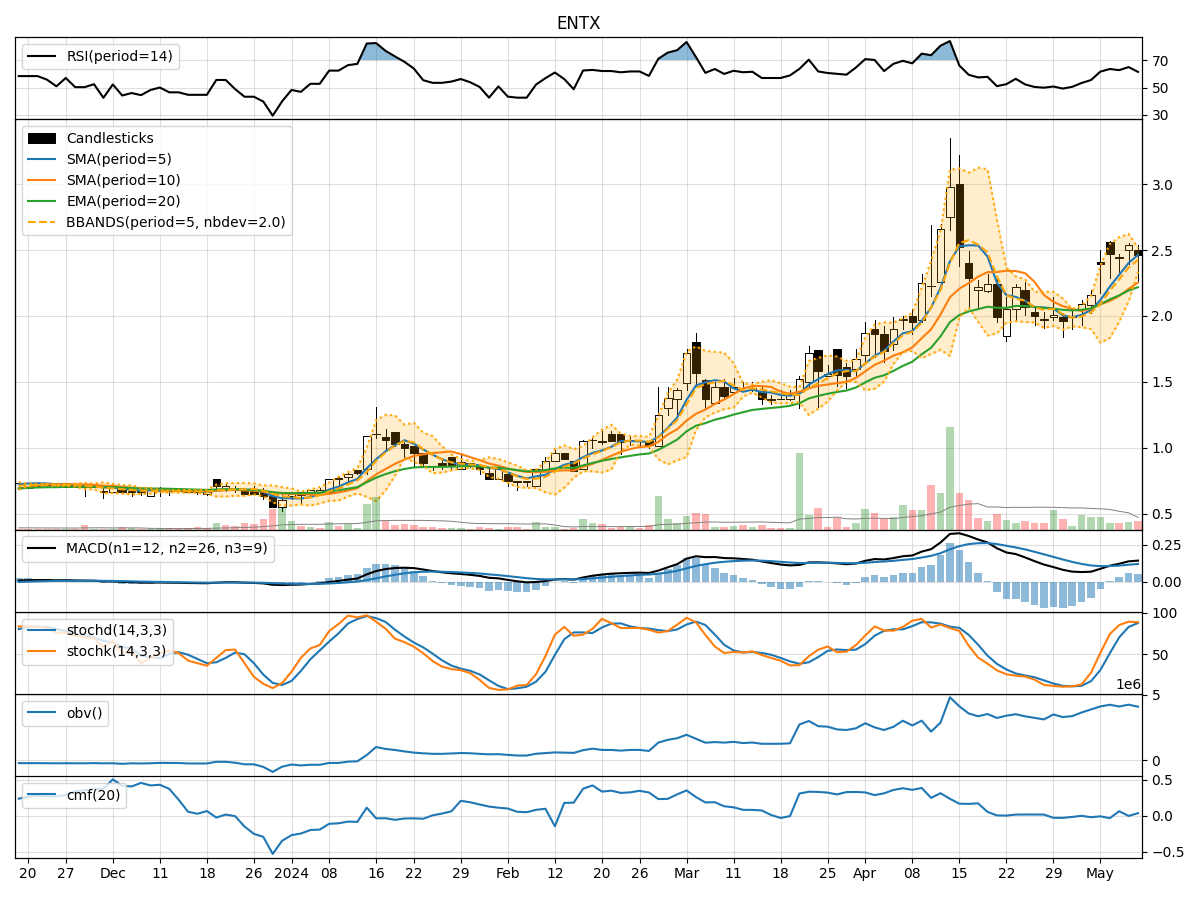
In analyzing the technical indicators for ENTX over the last 5 days, we will delve into the trend, momentum, volatility, and volume indicators to provide a comprehensive assessment of the stock's potential price movement. By examining these key factors, we aim to offer valuable insights and predictions for the next few days.
Trend Analysis:
- Moving Averages (MA): The 5-day Moving Average (MA) has been consistently above the Simple Moving Average (SMA) and Exponential Moving Average (EMA), indicating a bullish trend.
- MACD: The MACD line has been consistently above the signal line, with both lines showing an upward trend, suggesting bullish momentum.
- MACD Histogram: The MACD Histogram has been increasing over the past 5 days, indicating strengthening bullish momentum.
Momentum Analysis:
- RSI: The Relative Strength Index (RSI) has been fluctuating around the 60-65 range, indicating a neutral momentum.
- Stochastic Oscillator: Both %K and %D lines of the Stochastic Oscillator have been in the overbought zone, suggesting a potential reversal or consolidation.
- Williams %R: The Williams %R has been hovering in the oversold territory, indicating a potential buying opportunity.
Volatility Analysis:
- Bollinger Bands: The Bollinger Bands have been narrowing, suggesting decreasing volatility in the stock price.
- Bollinger %B: The %B indicator has been decreasing, indicating the price is closer to the lower band, potentially signaling a buying opportunity.
Volume Analysis:
- On-Balance Volume (OBV): The OBV has been fluctuating, indicating mixed buying and selling pressure.
- Chaikin Money Flow (CMF): The CMF has been oscillating around zero, suggesting a balance between buying and selling pressure.
Conclusion:
Based on the analysis of the technical indicators, the stock is currently exhibiting a bullish trend with strong momentum indicated by the MACD. However, the overbought signals from the Stochastic Oscillator and potential buying opportunity from Williams %R suggest a possible consolidation or minor pullback in the near term. The decreasing volatility as indicated by the Bollinger Bands and the mixed volume signals further support the view of a sideways movement in the stock price.
Recommendation:
Considering the overall technical picture, it is advisable to exercise caution in the short term and monitor the price action closely for any signs of a reversal or continuation of the bullish trend. Traders may consider taking profits if the stock price shows signs of weakness, while long-term investors could use any pullbacks as buying opportunities to add to their positions.