Technical Analysis of ENLV 2024-05-10
Overview:
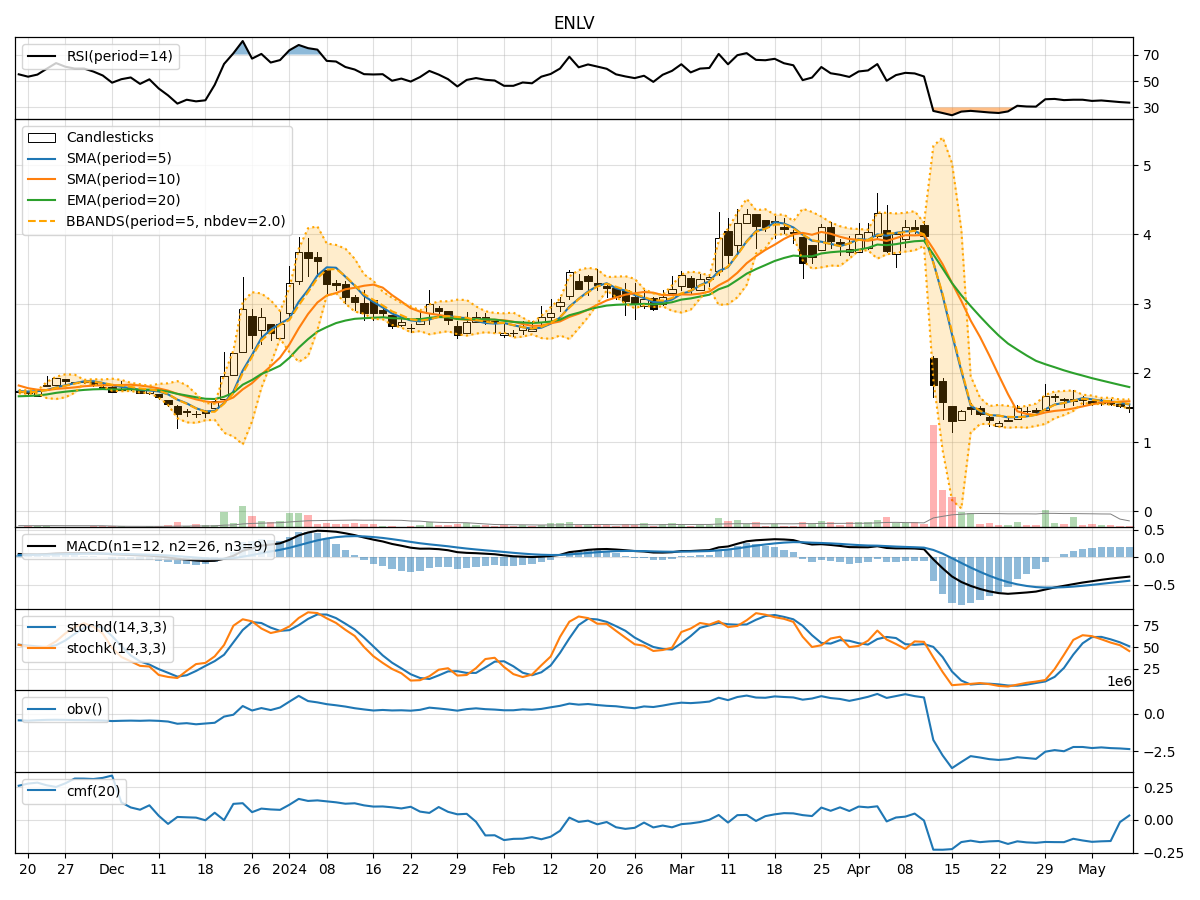
In analyzing the technical indicators for ENLV over the last 5 days, we will delve into the trend, momentum, volatility, and volume indicators to provide a comprehensive outlook on the possible stock price movement in the coming days.
Trend Analysis:
- Moving Averages (MA): The 5-day MA has been consistently below the closing price, indicating a short-term bearish trend.
- MACD: The MACD line has been negative, suggesting a bearish momentum in the stock price.
- RSI: The RSI values have been decreasing, reflecting a weakening momentum in the stock.
Momentum Analysis:
- Stochastic Oscillator: Both %K and %D values have been declining, indicating a bearish momentum.
- Williams %R (WillR): The values have been in oversold territory, signaling a potential reversal or bounce.
Volatility Analysis:
- Bollinger Bands (BB): The stock price has been trading within the lower Bollinger Band, indicating a potential oversold condition.
- BB Percentage (BBP): The BBP values have been increasing, suggesting a potential rebound in the stock price.
Volume Analysis:
- On-Balance Volume (OBV): The OBV values have been consistently negative, indicating selling pressure in the stock.
- Chaikin Money Flow (CMF): The CMF values have been decreasing, reflecting a bearish money flow trend.
Key Observations:
- The stock is currently in a downtrend based on moving averages and MACD.
- Momentum indicators like Stochastic Oscillator and RSI suggest a bearish sentiment in the market.
- Volatility indicators like Bollinger Bands and BB Percentage indicate a potential oversold condition.
- Volume indicators such as OBV and CMF point towards selling pressure in the stock.
Conclusion:
Based on the analysis of the technical indicators, the next few days' possible stock price movement for ENLV is likely to be downward or sideways. The bearish trend, negative momentum, and selling pressure indicated by various indicators suggest that the stock may continue to face challenges in the near term. Traders and investors should exercise caution and consider waiting for more positive signals before considering any long positions.