Technical Analysis of ENGN 2024-05-10
Overview:
In analyzing the technical indicators for ENGN over the last 5 days, we will delve into the trend, momentum, volatility, and volume indicators to provide a comprehensive outlook on the possible stock price movement in the coming days. By examining these key aspects, we aim to offer valuable insights and predictions to guide your investment decisions.
Trend Analysis:
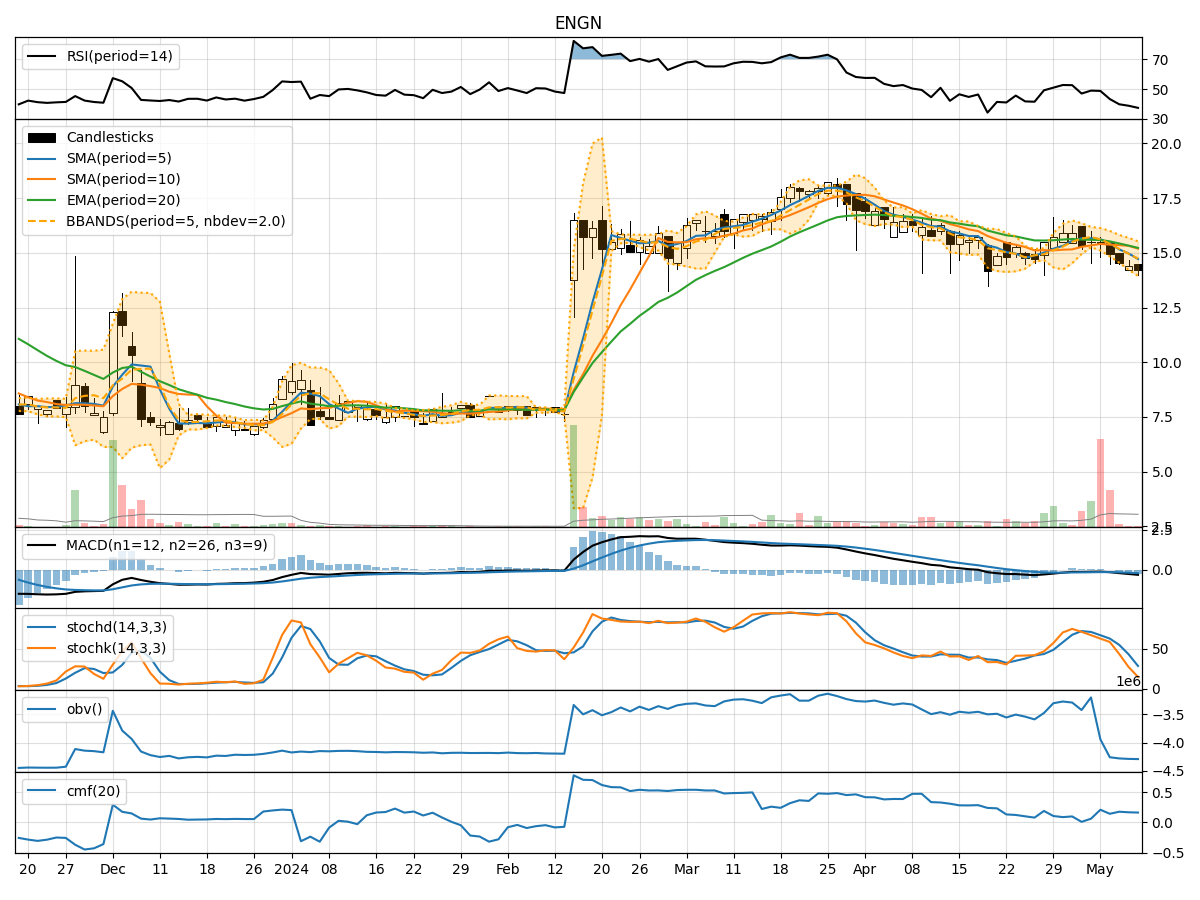
- Moving Averages (MA): The 5-day Moving Average (MA) has been consistently decreasing, indicating a downward trend in the stock price.
- MACD: The Moving Average Convergence Divergence (MACD) is also negative and decreasing, suggesting bearish momentum in the stock.
- EMA: The Exponential Moving Average (EMA) is below the current price, further supporting the bearish trend.
Momentum Analysis:
- RSI: The Relative Strength Index (RSI) is below 50, indicating a bearish momentum in the stock.
- Stochastic Oscillator: Both %K and %D are in oversold territory, signaling a potential reversal or continuation of the downtrend.
- Williams %R: The Williams %R is in the oversold region, suggesting a possible bounce back in the stock price.
Volatility Analysis:
- Bollinger Bands: The Bollinger Bands are narrowing, indicating decreasing volatility in the stock.
- Bollinger %B: The %B is below 0.2, suggesting that the stock is oversold and may see a potential reversal.
Volume Analysis:
- On-Balance Volume (OBV): The OBV has been negative, indicating selling pressure in the stock.
- Chaikin Money Flow (CMF): The CMF is positive but decreasing, signaling a potential outflow of money from the stock.
Key Observations:
- The trend indicators, momentum oscillators, and volume indicators all point towards a bearish sentiment in the stock.
- The narrowing Bollinger Bands and oversold conditions in the momentum indicators suggest a possible reversal or consolidation in the near future.
- The decreasing OBV and CMF indicate weakening buying pressure and potential profit-taking by investors.
Conclusion:
Based on the analysis of the technical indicators, the next few days' possible stock price movement for ENGN is likely to be downward with a potential for a short-term reversal or consolidation before resuming the bearish trend. Investors should exercise caution and consider waiting for more confirmation signals before making any significant trading decisions.