Technical Analysis of EM 2024-05-10
Overview:
In analyzing the technical indicators for the stock over the last 5 days, we will delve into the trend, momentum, volatility, and volume indicators to provide a comprehensive outlook on the possible stock price movement in the coming days. By examining these key indicators, we aim to offer valuable insights and predictions for informed decision-making.
Trend Analysis:
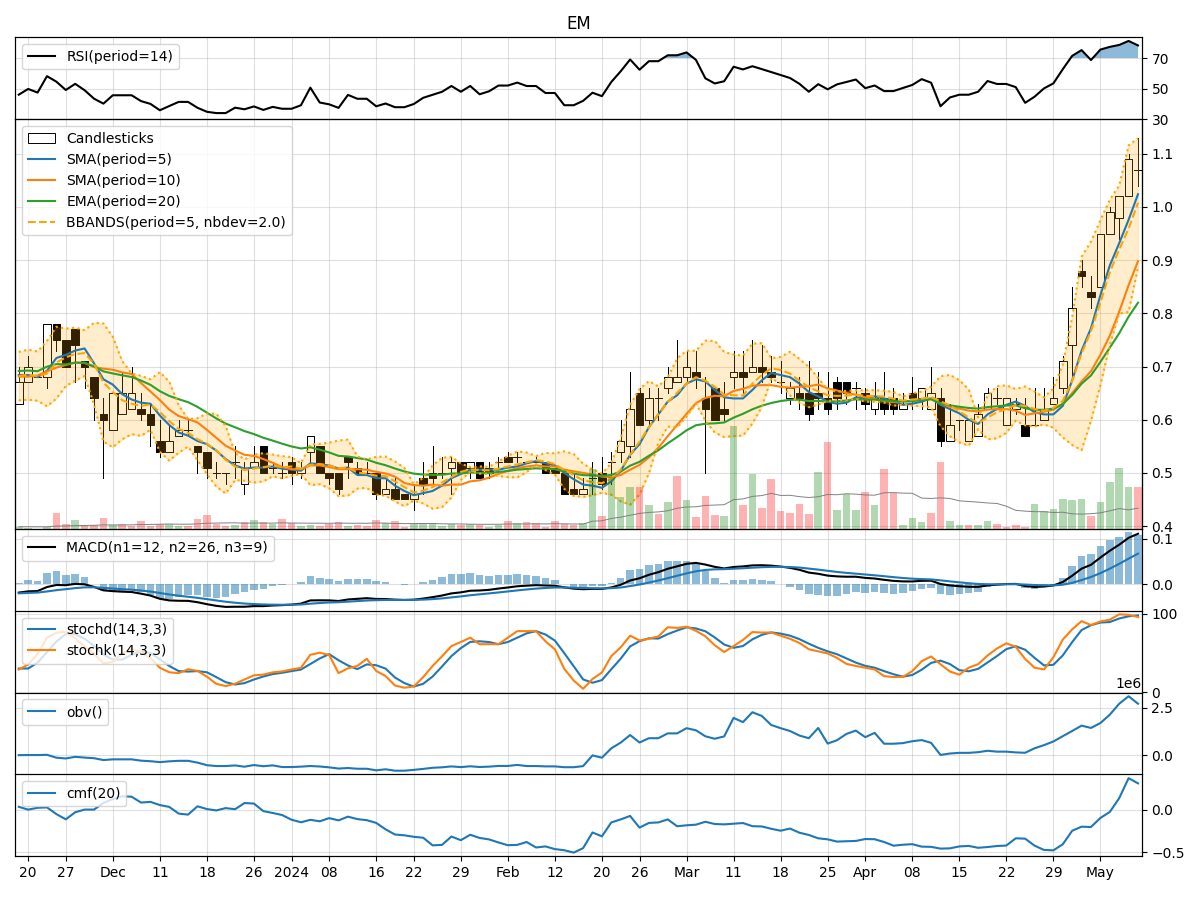
- Moving Averages (MA): The stock's closing prices have been consistently above the 5-day Moving Average (MA), indicating a bullish trend.
- MACD: The MACD line has been consistently above the signal line, suggesting a bullish momentum in the stock price.
- EMA: The Exponential Moving Average (EMA) has been steadily increasing, further supporting the bullish trend.
Momentum Analysis:
- RSI: The Relative Strength Index (RSI) has been in the overbought territory, indicating a strong bullish momentum.
- Stochastic Oscillator: Both %K and %D lines of the Stochastic Oscillator have been in the overbought zone, signaling a potential reversal or consolidation.
- Williams %R: The Williams %R is in the oversold region, suggesting a possible reversal in the stock price.
Volatility Analysis:
- Bollinger Bands: The stock price has been trading within the upper Bollinger Band, indicating high volatility and a potential overbought condition.
- Bollinger %B: The %B indicator is above 0.8, suggesting a potential reversal or pullback in the stock price.
Volume Analysis:
- On-Balance Volume (OBV): The OBV indicator has been increasing, reflecting accumulation by investors.
- Chaikin Money Flow (CMF): The CMF indicator has turned positive, indicating buying pressure in the stock.
Conclusion:
Based on the analysis of the technical indicators, the stock is currently in a strong bullish phase with overbought conditions in momentum indicators like RSI and Stochastic Oscillator. The increasing OBV and positive CMF further support the bullish outlook. However, the overbought signals in momentum indicators suggest a potential short-term consolidation or pullback in the stock price. Traders should be cautious of a possible reversal in the coming days.
In conclusion, while the overall trend remains bullish, investors should closely monitor the momentum indicators for signs of a reversal or consolidation. It is advisable to wait for a clearer signal before making significant trading decisions.