Technical Analysis of EH 2024-05-10
Overview:
In analyzing the technical indicators for EH stock over the last 5 days, we will delve into the trend, momentum, volatility, and volume indicators to provide a comprehensive outlook on the possible stock price movement in the coming days. By examining these key aspects, we aim to offer valuable insights and predictions to guide your investment decisions.
Trend Analysis:
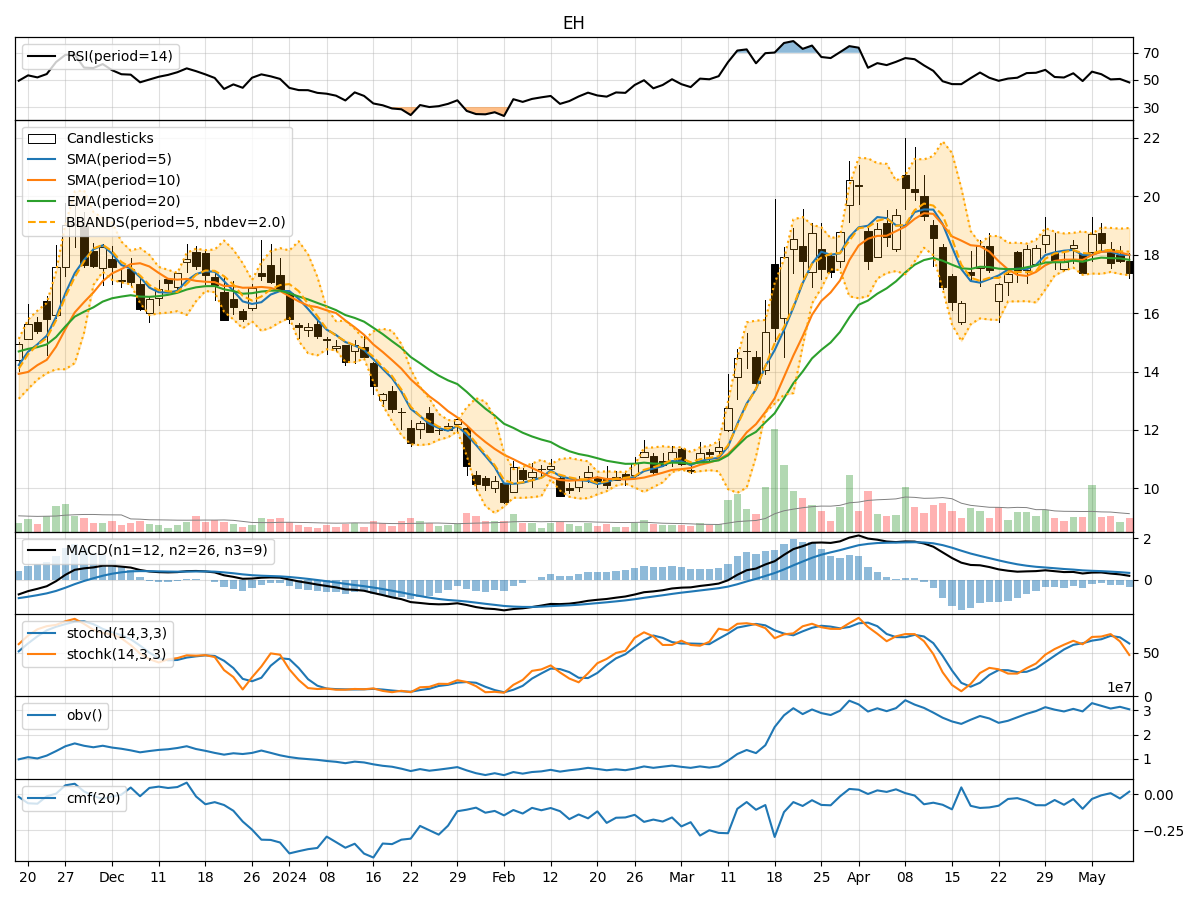
- Moving Averages (MA): The 5-day Moving Average (MA) has been relatively stable around $17.99 to $18.11, indicating a consistent price trend.
- MACD and Signal Line: The MACD line has shown a positive trend, staying above the signal line, suggesting bullish momentum in the stock.
- Relative Strength Index (RSI): The RSI has been fluctuating around 50, indicating a neutral stance in terms of price momentum.
Momentum Analysis:
- Stochastic Oscillator: The Stochastic Oscillator has been fluctuating but is currently in the oversold territory, suggesting a potential reversal in price direction.
- Williams %R (Willr): The Williams %R indicator has been consistently in the oversold region, indicating a possible buying opportunity.
Volatility Analysis:
- Bollinger Bands (BB): The Bollinger Bands have shown narrowing volatility, with the stock price approaching the lower band, signaling a potential reversal or consolidation phase.
- Bollinger %B (bbp): The %B indicator is currently below 0.2, indicating an oversold condition.
Volume Analysis:
- On-Balance Volume (OBV): The OBV indicator has been declining, suggesting selling pressure in the stock.
- Chaikin Money Flow (CMF): The CMF has been fluctuating around zero, indicating a balance between buying and selling pressure.
Key Observations:
- The stock is currently in a consolidation phase, with indicators showing mixed signals.
- The MACD and Stochastic Oscillator suggest a potential bullish reversal, while the RSI and OBV indicate a neutral to bearish sentiment.
- The narrowing Bollinger Bands and oversold Williams %R point towards a possible price reversal or consolidation.
Conclusion:
Based on the analysis of the technical indicators, the next few days may see sideways movement or a potential bullish reversal in EH stock. Traders should closely monitor the price action for confirmation of a trend reversal. Consider setting stop-loss levels to manage risk effectively.