Technical Analysis of EGOX 2024-04-26
Overview:
In analyzing the technical indicators for EGOX over the last 5 days, we will delve into the trend, momentum, volatility, and volume indicators to provide a comprehensive outlook on the possible stock price movement in the coming days. By examining these key aspects, we aim to offer valuable insights and recommendations for potential investors.
Trend Analysis:
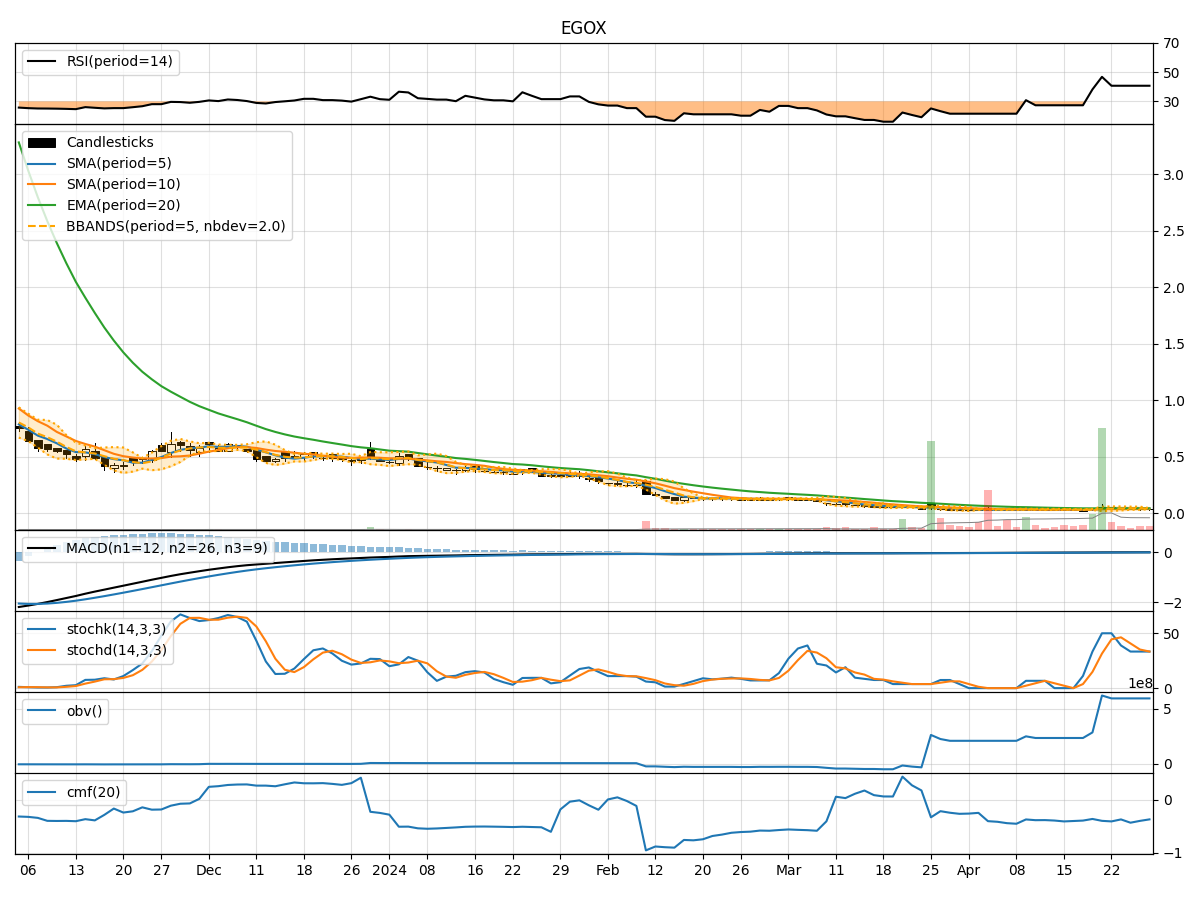
- Moving Averages (MA): The 5-day MA has been fluctuating around the closing price, indicating short-term price stability.
- MACD: The MACD line has been consistently negative, suggesting a bearish trend.
- EMA: The EMA has been declining, reflecting a downward price momentum.
Key Observation: The trend indicators point towards a bearish sentiment in the short term.
Momentum Analysis:
- RSI: The RSI has been hovering around the neutral zone, indicating a lack of strong momentum.
- Stochastic Oscillator: Both %K and %D have been in oversold territory, signaling a potential reversal.
- Williams %R: The indicator has consistently remained in oversold territory.
Key Observation: Momentum indicators suggest a possible reversal or consolidation in the near future.
Volatility Analysis:
- Bollinger Bands (BB): The bands have been narrowing, indicating decreasing volatility.
- BB %B: The %B has been fluctuating around the midline, suggesting a balanced market sentiment.
Key Observation: Volatility indicators point towards a period of consolidation or a potential breakout.
Volume Analysis:
- On-Balance Volume (OBV): The OBV has been relatively stable, indicating no significant divergence between price and volume.
- Chaikin Money Flow (CMF): The CMF has been negative, reflecting selling pressure in the market.
Key Observation: Volume indicators suggest a lack of strong buying interest and potential selling pressure.
Conclusion:
Based on the analysis of the technical indicators, the next few days' possible stock price movement for EGOX is likely to be sideways with a bearish bias. The trend indicators indicate a bearish sentiment, while momentum indicators suggest a potential reversal or consolidation. Volatility indicators point towards a period of consolidation, and volume indicators reflect selling pressure in the market.
Recommendation: It is advisable to closely monitor the price action and key support levels for potential entry or exit points. Consider waiting for confirmation of a trend reversal before making any significant trading decisions.