Technical Analysis of EDTK 2024-05-10
Overview:
In analyzing the technical indicators for EDTK over the last 5 days, we will delve into the trend, momentum, volatility, and volume indicators to provide a comprehensive outlook on the possible stock price movement. By examining these key aspects, we aim to offer valuable insights and predictions for the upcoming trading days.
Trend Analysis:
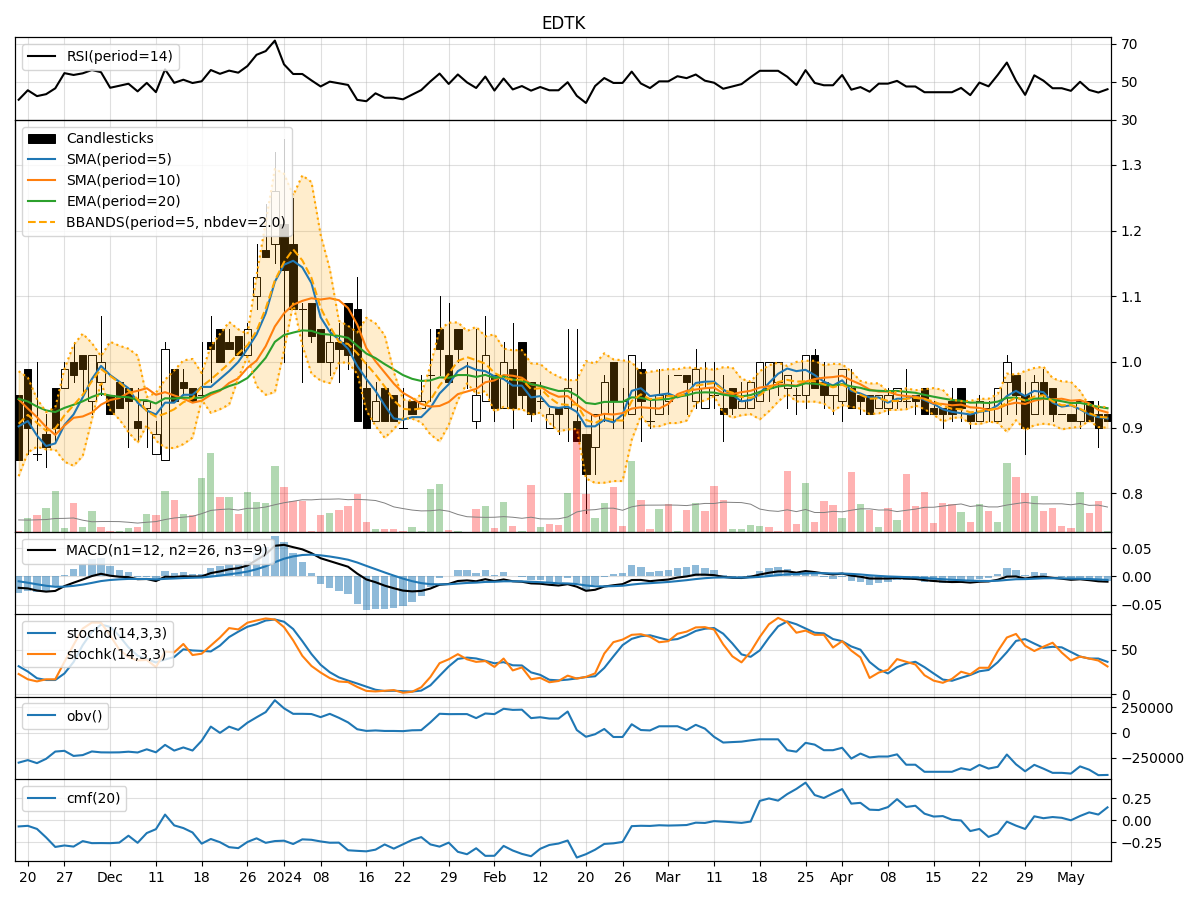
- Moving Averages (MA): The 5-day Moving Average (MA) has been consistently below the Simple Moving Average (SMA) and Exponential Moving Average (EMA), indicating a downward trend.
- MACD: The Moving Average Convergence Divergence (MACD) has been negative, with the MACD line below the signal line, suggesting bearish momentum.
Momentum Analysis:
- RSI: The Relative Strength Index (RSI) has been hovering around the mid-level, indicating a neutral momentum.
- Stochastic Oscillator: Both %K and %D have been in the oversold territory, signaling a potential reversal or consolidation.
Volatility Analysis:
- Bollinger Bands (BB): The stock price has been trading within the lower Bollinger Band, suggesting a period of low volatility.
Volume Analysis:
- On-Balance Volume (OBV): The OBV has been declining, indicating selling pressure in the stock.
- Chaikin Money Flow (CMF): The CMF has been positive, reflecting some buying interest in the stock.
Key Observations:
- The trend indicators show a clear bearish sentiment with the stock price below key moving averages and a negative MACD.
- Momentum indicators suggest a neutral stance with RSI around the midpoint and stochastic indicators in oversold territory.
- Volatility remains low as the stock price trades within the lower Bollinger Band.
- Volume indicators point towards selling pressure as OBV declines, although CMF indicates some buying interest.
Conclusion:
Based on the analysis of technical indicators, the outlook for EDTK in the next few days is bearish. The stock is likely to continue its downward trend, supported by the negative MACD and bearish moving averages. While there may be some potential for a short-term reversal indicated by oversold stochastic levels, the overall sentiment remains negative. Traders should exercise caution and consider shorting or staying on the sidelines until a clearer bullish signal emerges.