Technical Analysis of EDSA 2024-05-10
Overview:
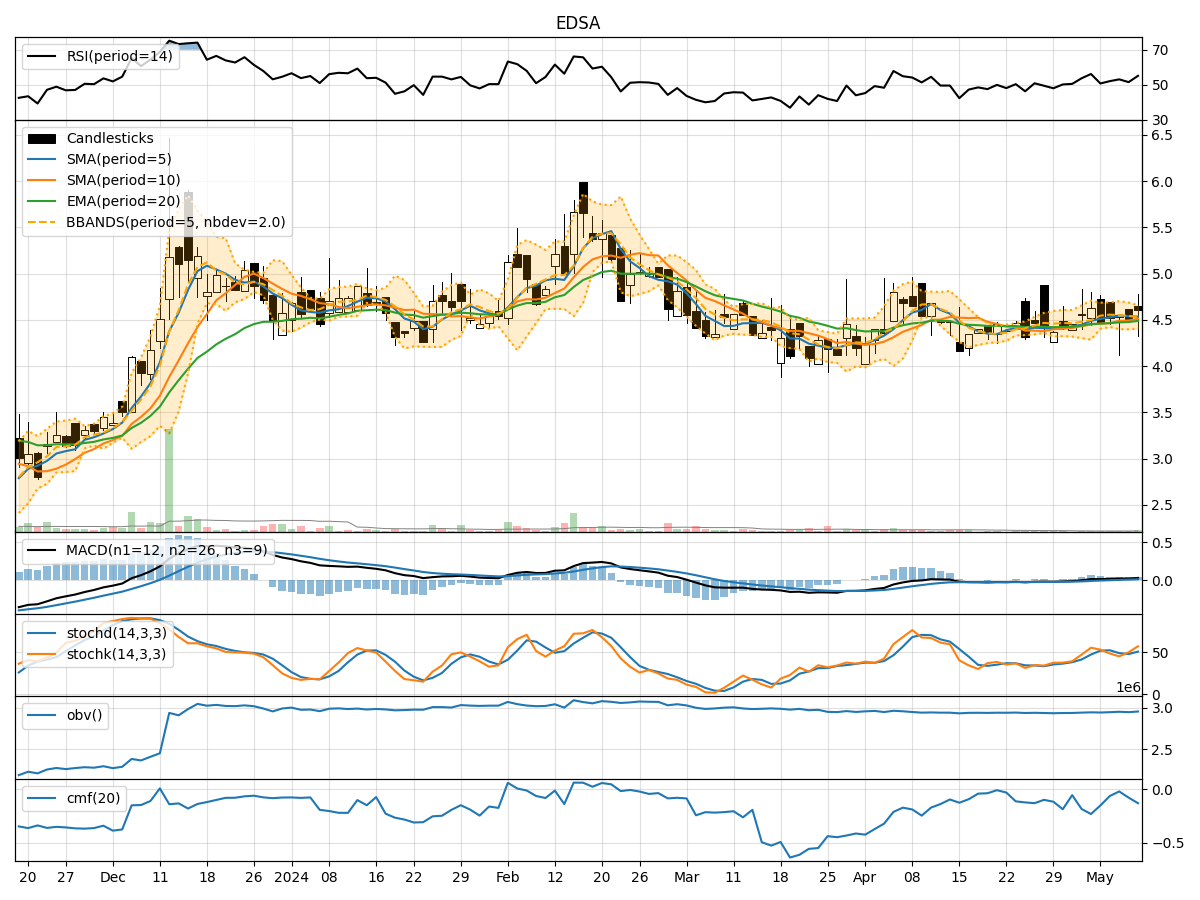
In analyzing the technical indicators for EDSA over the last 5 days, we will delve into the trend, momentum, volatility, and volume indicators to provide a comprehensive outlook on the possible stock price movement. By examining these key factors, we aim to offer valuable insights and predictions for the upcoming days.
Trend Analysis:
- Moving Averages (MA): The 5-day Moving Average (MA) has been steadily increasing, indicating a positive trend in the stock price.
- MACD: The Moving Average Convergence Divergence (MACD) has shown consistent positive values, suggesting bullish momentum in the stock.
- EMA: The Exponential Moving Average (EMA) has been on an upward trajectory, supporting the bullish trend.
Momentum Analysis:
- RSI: The Relative Strength Index (RSI) has been fluctuating around the neutral zone, indicating a balanced momentum in the stock.
- Stochastic Oscillator: Both %K and %D values have been oscillating, reflecting indecision in the momentum.
- Williams %R: The Williams %R is hovering around oversold levels, suggesting a potential reversal in momentum.
Volatility Analysis:
- Bollinger Bands (BB): The Bollinger Bands have shown narrowing, indicating decreasing volatility in the stock price.
- BB% (Bollinger Band %B): The %B value has been fluctuating, reflecting mixed signals in volatility.
Volume Analysis:
- On-Balance Volume (OBV): The OBV has shown a slight decrease, suggesting some selling pressure in the stock.
- Chaikin Money Flow (CMF): The CMF has been negative, indicating outflow of money from the stock.
Key Observations:
- The trend indicators suggest a bullish sentiment in the stock price, supported by positive MA, MACD, and EMA values.
- Momentum indicators show mixed signals with RSI in the neutral zone and stochastic oscillators indicating indecision.
- Volatility has been decreasing as per the narrowing Bollinger Bands, while volume indicators reflect some selling pressure with a negative OBV and CMF.
Conclusion:
Based on the analysis of technical indicators, the stock price of EDSA is likely to experience further upward movement in the next few days. The bullish trend indicated by moving averages and MACD, coupled with decreasing volatility, supports a positive outlook. However, the mixed signals in momentum indicators suggest a cautious approach, and investors should monitor the stock closely for any signs of reversal. Overall, the bullish sentiment is favored for the upcoming days.