Technical Analysis of EBON 2024-05-10
Overview:
In analyzing the technical indicators for EBON over the last 5 days, we will delve into the trend, momentum, volatility, and volume indicators to provide a comprehensive outlook on the possible stock price movement in the coming days. By examining these key indicators, we aim to offer valuable insights and recommendations for potential investors.
Trend Analysis:
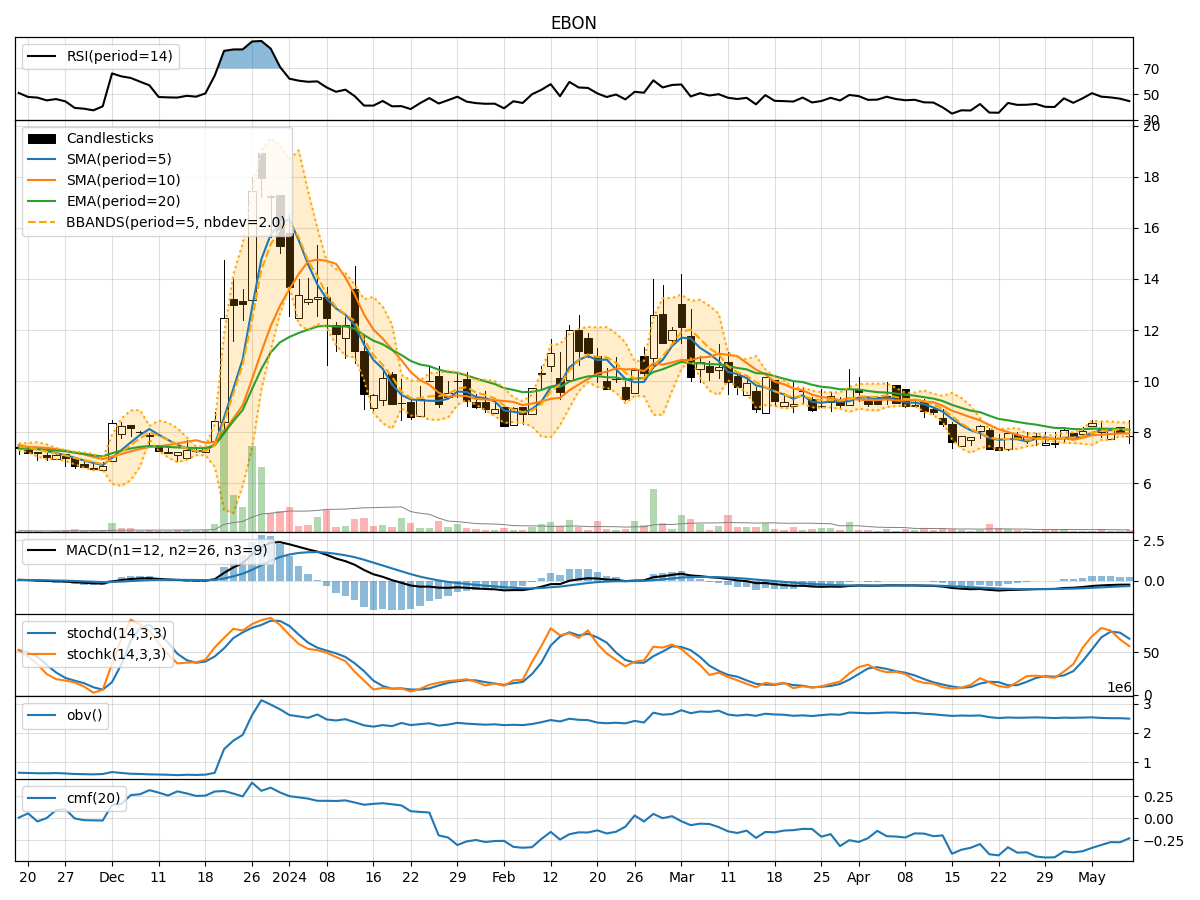
- Moving Averages (MA): The 5-day Moving Average (MA) has been fluctuating around the closing prices, indicating short-term price trends. The Simple Moving Average (SMA) and Exponential Moving Average (EMA) show a slight downtrend, suggesting a weakening price momentum.
- Moving Average Convergence Divergence (MACD): The MACD and Signal Line have been negative, indicating a bearish trend in the stock price.
Momentum Analysis:
- Relative Strength Index (RSI): The RSI has been decreasing, indicating a loss in buying momentum and potential oversold conditions.
- Stochastic Oscillator: Both %K and %D have been declining, signaling a bearish momentum in the stock price.
- Williams %R (WillR): The Williams %R is in the oversold territory, suggesting a potential reversal or bounce in the stock price.
Volatility Analysis:
- Bollinger Bands (BB): The Bollinger Bands have been narrowing, indicating decreasing volatility and a possible period of consolidation.
Volume Analysis:
- On-Balance Volume (OBV): The OBV has been declining, suggesting that selling pressure has been increasing.
- Chaikin Money Flow (CMF): The CMF has been negative, indicating a lack of buying interest in the stock.
Key Observations:
- The stock is currently in a downtrend based on the moving averages and MACD.
- Momentum indicators like RSI and Stochastic Oscillator suggest a bearish sentiment in the market.
- Volatility is decreasing, indicating a potential consolidation phase.
- The declining OBV and negative CMF point towards weakening buying interest in the stock.
Conclusion:
Based on the analysis of the technical indicators, the next few days for EBON are likely to see a continuation of the downward trend with increased selling pressure. The momentum indicators suggest a bearish outlook, while the decreasing volatility may lead to a period of consolidation before any potential reversal. Investors should exercise caution and consider waiting for more positive signals before considering any long positions.